Agent Visualizer Components
Use Agent Visualizer to identify the parts of your agent network and see how they work together.
-
Distinguish node types (agents and MCP servers).
-
View edges to see declared and runtime interactions.
-
Use layers to focus views on specific environments
-
Open details cards to inspect metadata and metrics for nodes and access logs and traces
-
Review governance indicators such as Omni Gateway protection and applied policies.
Node Types
Nodes in the agent network provide a visual representation of the agents and MCP servers within your agent network including:
For more information, see Viewing Node Details.
| Agent Visualizer shows a maximum of 500 nodes. If you have more than 500 nodes, you won’t see all of them on the canvas. You can use search to locate specific nodes. |
Edges
Edges represent the relationships and communications among your nodes:
-
Declared edges appear between node instances when no runtime information is available because there’s no registered traffic between them. Dashed lines on the graph indicate declared edges.
-
Runtime edges appear between nodes when traffic is registered and a managed Omni Gateway exists. Solid lines on the graph indicate runtime edges. Click a runtime edge to open the details card and show the relevant metrics.
Edges are drawn under specific conditions, primarily when the calling agent is protected by a managed Omni Gateway at egress. For agent-to-MCP relationships, edges are automatically drawn when the calling agent’s egress or the MCP server’s ingress is protected by a managed Omni Gateway. No new policies or extra configuration are needed to make edges visible. For more information, see Deploying Agent Network Ingress and Egress Managed Omni Gateways
-
If an agent has an egress managed Omni Gateway, when it calls another agent, the edge is visible.
-
If the requesting agent doesn’t have an egress Omni Gateway, no edge metric is generated and the edge isn’t shown.
-
Broker agents that route outbound calls through an egress Omni Gateway, allowing requests between broker agents, or from a broker agent to an external agent, appear in the agent network visualization.
Selecting an edge opens the details card, which displays relationship information and metrics. For more information, see View Edge Details.
Data Flow Layers
Agent Visualizer provides a single, consistent architectural view of all assets defined in Exchange. The base graph doesn’t change when toggling between production and non-production environments.
-
Base graph
-
Always visible
-
Shows all assets defined in Exchange (agents and MCP servers) and their design‑time relationships from broker definitions
-
Topology and layout don’t change when switching layers
-
-
Production layer
-
Overlays production instances and metrics on existing nodes and edges
-
Hides sandbox traffic lines
-
-
Sandbox layer
-
Overlays sandbox instances (if they exist) and metrics on existing nodes and edges
-
Shows sandbox traffic as solid edges and hides production traffic lines
-
For more information about switching between production and sandbox environment layers, see View Data Flow Layers.
Details Cards
The details card is the primary means for gaining detailed, 360-degree information about a selected node or edge. It includes metadata and links to relevant resources like logs, policies, and more.
For more information, see View Node Details.
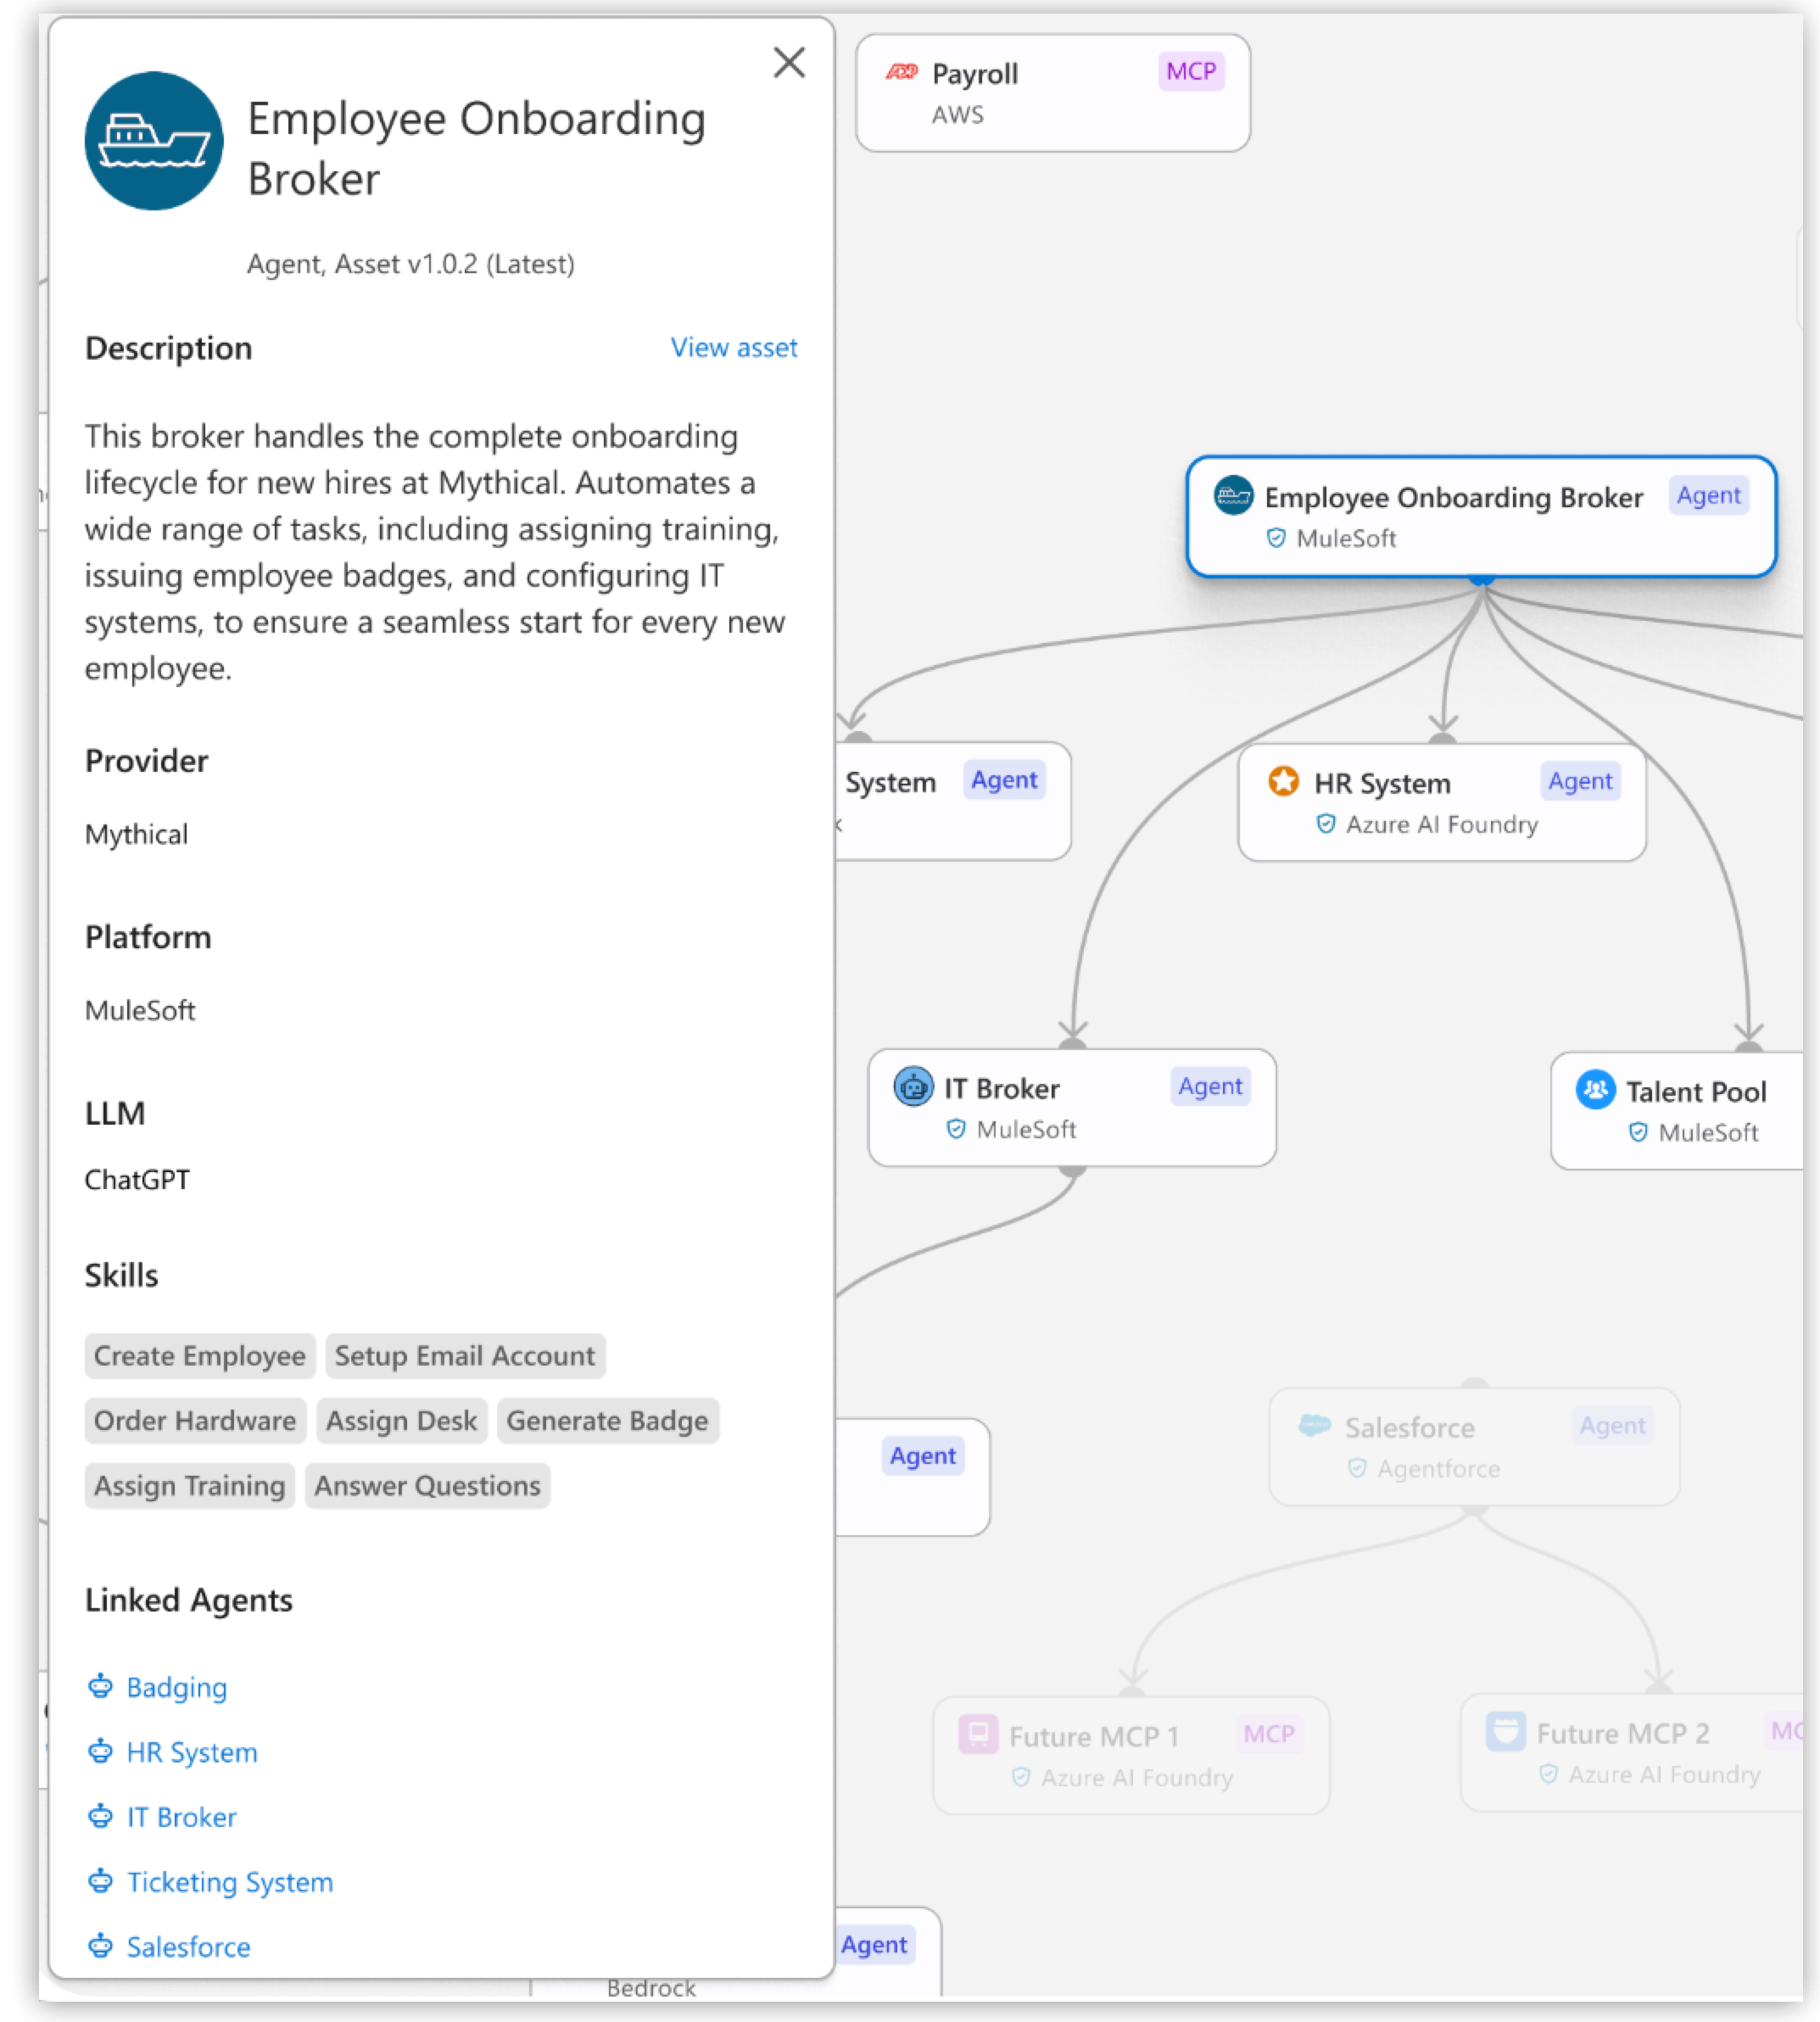
Node Metadata
When you select a node, the details card shows metadata for that agentic asset, including:
| Field | Description |
|---|---|
Name |
Name of the asset. |
Description |
Description of the asset. |
Provider |
Provider of the asset. |
Platform |
Platform of the asset, for example, Agentforce or MuleSoft. |
LLM |
LLM provider (for example, |
Skills |
Skills that are supported by the agent. Skills are concrete, callable operations within a capability, with defined input and output. For example, |
Linked Agents |
Agents that are linked to the broker. |
MCP Servers and Tools |
MCP servers and tools that are connected to the broker. |
Enabled Capabilities |
Capabilities that are supported by the agent. Capabilities are high-level areas of what an agent can do (domains it supports, for example, customer support or knowledge search). |
Instance Name |
Instance name as it appears in API Manager. |
Environment Type |
Environments the instance is deployed to, for example, |
Based on Asset Version |
Version of the instance. |
Policies |
Policies that are applied to the instance. |
Governance and Security |
Whether the asset is protected by an Omni Gateway. |
Performance and Health |
Performance and health metrics for the instance including:
|
Monitoring |
Links to logs and traces for quick access to troubleshooting tools. |
Tags |
All tags associated with the asset in Exchange. |
| Broker metadata is defined in the agent network YAML. For more information about the agent network YAML, see Define Your Agent Network. |
Instance Information for an Agent
When you select an agent node, the details card shows environment-specific instance details for that asset, including:
-
Latest asset version
The details card always shows the most recent (latest) asset version (highlighted) first, along with its corresponding instances in the selected environment (Production or Sandbox).
-
All earlier versions
All previous (earlier) instance versions are shown under the latest version.
Each instance entry includes the asset version number, so you can easily distinguish between versions.
-
Descending order of asset versions
Instances are ordered from the most recent (latest) to least recent (earliest) asset version, making it easy to track version history over time.
MCP Server Details
The MCP server details card includes active MCP tools and per‑instance activity.
-
Active tools reflect the selected Activity Period and only include tools invoked during that window.
-
Tools are aggregated across all instances of the MCP server, ranked by throughput, with the top 10 displayed by default. Select Show More to view additional tools.
| Publish MCP assets in Exchange before the tools are visible. Tools also require telemetry from a managed Omni Gateway on the relevant path. Runtime usage shows only allowlisted tools that have been called. |