
Deploying Apps to Private Spaces
You deploy apps to a private space using Runtime Manager.
| CloudHub 2.0 supports Mule runtime engine versions 4.3.x and later. |
| Runtime Manager doesn’t support deploying an application to CloudHub 2.0 or Runtime Fabric if the asset was previously soft-deleted in Exchange. |
Deploy an App to a Private Space
-
From Anypoint Platform, select Runtime Manager > Applications.
-
Click Deploy application.
-
On the Deploy Application page:
-
Enter the name of the application.
You cannot change the name of an app after you deploy it. To change the name, you must delete and redeploy the app using the new name. -
Select an application file:
-
To upload a Mule app JAR file from your system, select Choose file > Upload file.
File names can contain only letters, numbers, and underscores per guidelines on unique package names. -
To choose an example app from Anypoint Exchange:
-
Select Choose file > Import file from Exchange.
-
On the Get from Exchange page, enter
helloin the Search assets by name: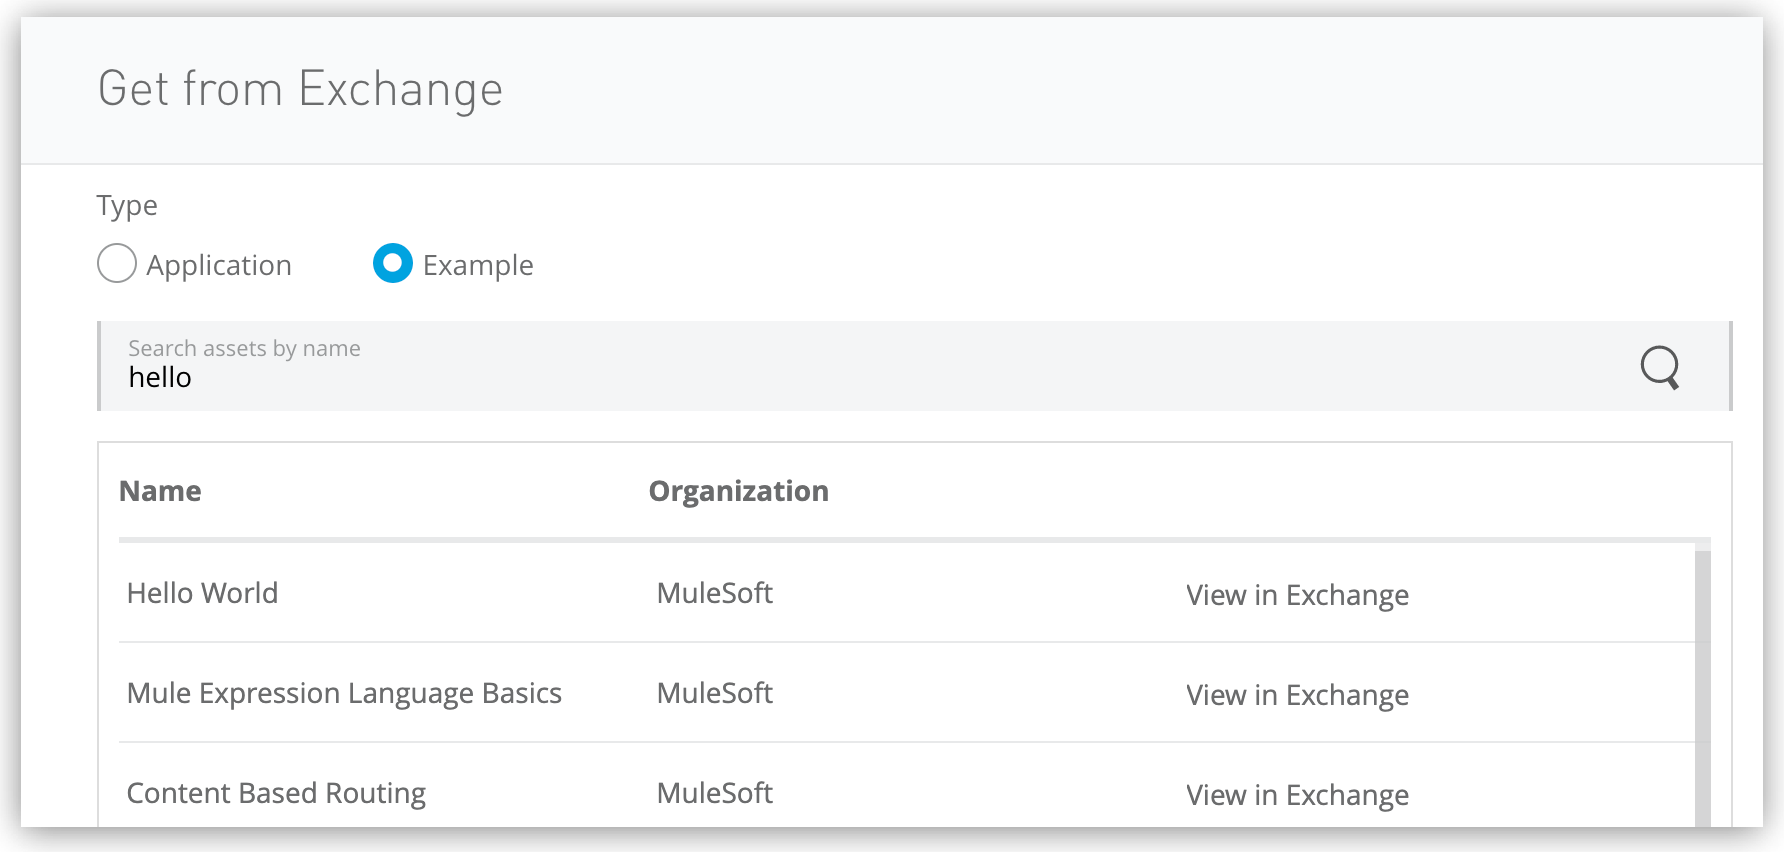
-
Click Hello World and then click Select.
-
-
-
Select the name of the private or shared space from the Deployment Target list.
-
Configure options for deployment:
-
-
Click Deploy Application.
Specify Runtime Options
Click the Runtime tab and specify the following options:
- Runtime version
-
Specifies the Mule runtime engine version. Versions 4.3.x, 4.4.x, 4.5.x, and 4,6.x are supported.
- Release Channel
-
Starting with Mule 4.5, MuleSoft introduces two new release channels, Edge and Long-term Support (LTS).
For new applications, the Edge channel is selected by default in the Release Channel drop-down menu.
For existing applications using a legacy version, the Release Channel drop-down list is selected as
Noneby default. Use the Release Channel drop-down list to select the desired release channel.For existing applications using an Edge version, the Release Channel drop-down list is selected as
Edge. The Runtime Version dropdown list indicates if there is an update available, as well as the previous and latest version of the application. Use the Release Channel drop-down list to change to a legacy version.For existing applications using an Edge or an LTS version on extended support, a warning message appears indicating the version’s EOL.
After End of Extended Support for Mule runtime 4.3 and 4.4, Mule applications deployed to CloudHub or CloudHub 2.0 environments are stopped. - Java Version
-
Select the Java version for your application. For more information, visit Java Support.
- Replica size
-
Specifies the number of vCores in the replica to run your application.
For information on replica sizes, memory, and storage, see CloudHub 2.0 Replicas. CloudHub 2.0 limits the replica size per deployment to four vCores.
- Replica Count
-
Specifies the number of replicas, or instances, of the application to deploy.
A minimum of two replicas is required for high availability.
- Run in Runtime Cluster Mode
-
Enables Mule clustering across each replica of the application.
This option requires at least two replicas.
- Use Object Store V2
-
You can select Object Store v2 as the implementation by checking the Use Object Store V2 checkbox.
- Deployment model
-
-
Rolling update:
-
Maintains availability by incrementally updating replicas.
-
-
Recreate:
-
Terminates replicas before redeployment.
-
Redeployment is faster and doesn’t require additional resources.
-
-
Configure Endpoints and Paths for the App
For more information, see Configuring Endpoints and Paths for Apps Deployed to a Private Space.
To configure endpoints for the app to enable access from the internet:
-
Click the Ingress tab and specify the following options:
- Endpoint
-
-
Host: Select the domain, such as
cloudhub.io, for the app from the drop-down list.If you select cloudhub.io(the default domain), you can’t select a subdomain or path.The administrator configures the domains and certificates (TLS context) for the private space. See Configuring Domains and Certificates (TLS Context) for a Private Space.
After you select the domain for a private space, you can view the corresponding TLS context by clicking View TLS Context:
-
Subdomain: If the domain you selected includes a wildcard, you can configure the subdomain.
Subdomains must start and end with an alphanumeric character and can contain only alphanumeric characters (a-z, A-Z, 0-9), hyphens (-), underscores (-), and periods (.).
Subdomains support placeholders. The default subdomain is
app-name, which resolves to the name of the app that you specified in the Application Name field when you deploy the app. -
Path: specifies the URL path to the application endpoint.
Paths must start and end with an alphanumeric character and can contain only alphanumeric characters, hyphens, and underscores.
Paths support placeholders.
-
To add an endpoint, click Add Endpoint and specify options.
-
To remove an endpoint, click the X in the endpoint row.
Depending on the control plane you’re deploying to, the endpoint URL format requires the region suffix before cloudhub.ioor not. For applications deployed to the US control plane, don’t add the region suffix, for example:https://.10u6w7.usa-e1.cloudhub.io. For applications deployed to any of the other control planes, add the corresponding region suffix, for example:https://.10u6w7.usa-e1.eu1.cloudhub.io. -
- Path Rewrite
-
If the HTTP Listener in your app listens on a different path than the path defined in Endpoints:
-
Enable the Rewrite Request Paths option.
-
Enter the target path expected by your app.
Requests sent to your app use the path that you specify here.
Check these examples to see how the private space rewrites the path:
Application endpoint 1:
https://sapi-one-o4azsf.2x9yyp.usa-e2.cloudhub.io/acctPath rewrite 1:
/version1Application endpoint 2:
https://sapi-one-o4azsf.2x9yyp.usa-e2.cloudhub.io/acct/moreInfoPath rewrite 2:
/version1/moreInfo -
- TLS Options
-
-
Forward SSL Session
Enables SSL forwarding during a session.
SSL forwarding is mostly used with client authentication. See Enable Client Authentication. SSL forwarding forwards client certificate details in HTTP request headers so they are available to the application. These fields can identify an authenticated client and allow an application to determine and use the identity.
The following headers are available:
Header Name Value x-ssl-client-verify
SUCCESS/FAIL
x-ssl-issuer
Client certificate issuer
x-ssl-client-serial
Client certificate serial number
x-ssl-client-dn
Contents of the client certificate DN field
x-ssl-client-cert
Contents of the client certificate
-
Last-Mile Security
Specifies that TLS termination and decryption for the forwarded HTTPS connections occurs in the application.
This option requires that the Mule application include an SSL certificate and also requires more CPU resources.
-
-
Click Deploy Application to create a new configuration for your application.
Application Names
The application name you specify can contain between 3 and 42 alphanumeric characters (a-z, A-Z, 0-9) and dashes (-). They cannot contain spaces or other characters. The application name must start with a letter (a-z or A-Z). It cannot start with a number or dash and it cannot end with a dash.
To ensure that names are unique and avoid domain conflicts, CloudHub 2.0 adds
a six-character unique-id to the application name that you specify in the public endpoint URL.
The application name identifies your application not only in Runtime Manager but also in the public cloudhub.io domain.
For example, an application named myapp is accessible at http://myapp-unique-id.shard.usa-w2.cloudhub.io. You must have unique application names for each deployment target.
To further customize your app names, you can create a naming convention.
For example, you could prepend your company name and department to all application names,
such as mycompany-mydept-myapp.
You can then add DNS records to hide the complex application name.
For example, you might route requests to myapp.mycompany.com to mycompany-mydept-myapp-unique-id.shard.region.cloudhub.io.
Make application file names as unique as possible. An app cannot be deployed if it shares the same name as an asset in Exchange.
Placeholders
The subdomain and path support the following optional lowercase placeholders:
| Placeholder | Resolves to |
|---|---|
|
Name of the app that you specified in the Application Name field when you deploy the app |
|
Business group ID associated with the app |
|
Environment that you deploy the app to |
Change App Behavior with Properties
You can configure property values, such as specifying the environment or setting passwords and usernames, during app deployment.
For information about configuring app properties, see:
Configure Logging for the App
Logging is enabled by default for apps deployed to CloudHub 2.0.
Disable or Enable Logging
To disable or reenable logging for the app:
-
Click the Monitoring tab.
-
Deselect or select the Forward application logs to Anypoint Platform option.
-
Click Apply Changes.
If you disable logging, the Logs heading still appears in the Runtime Manager navigation menu, but application logs are not collected.
Configure Log Levels and Categories
To configure additional log levels and categories to include in logs:
-
Click the Monitoring tab.
-
Select the log level:
-
INFO: Informative messages
-
DEBUG: Debugging messages
-
WARNING: Warning messages
-
ERROR: Error messages, such as when an exception occurs
-
FATAL: Fatal messages for when an application fails
-
-
Optionally, set the log level for specific a Java package class by selecting the log level, entering the
package.name, and pressing the Enter key. -
Click Apply Changes.
| Changing the log level and clicking Apply Changes restarts the application. |
Enable Trace Data Collection
| This feature is available only if your organization has the Anypoint Integration Advanced package or a Titanium subscription to Anypoint Platform. For more information, see the Pricing and Packaging documentation. |
Traces enable you to understand the path of a transaction in the MuleSoft ecosystem by providing full visibility into the execution path of API calls or application transactions. When you enable trace data collection for an app, Anypoint Platform collects and exposes tracing information from Mule runtime engine in the OpenTelemetry standard, enabling you to export it using the Anypoint Monitoring Telemetry Exporter.
You can enable trace data collection for your CloudHub 2.0 applications running on Mule version 4.6 or later. You can’t enable trace data collection using the Mule Maven plugin, Anypoint CLI, or Anypoint Studio. You can enable trace data collection using only the UI and API.
To enable trace data collection for an app:
-
Click the Monitoring tab.
-
Select the Enable tracing checkbox.
-
Click Deploy Application if you are enabling the feature for a new deployment, or Apply Changes if you are editing an existing application.
Once you enable tracing, and redeploy your application, the Runtime Manager backend starts instrumenting traces for your application.