
Monitoring Metrics from Anypoint Insights
Monitor performance data and issues across your deployed Mule apps and API implementations (entities) with Anypoint Insights, in Anypoint Monitoring:
-
Check metrics across multiple Mule apps and API implementations.
Get up to the last 7 days of aggregate metrics on requests, errors, and responses across all your apps and APIs from the Anypoint Insights UI. This lookback limit applies to all subscription tiers. Use filters to narrow your results. You can download most chart data to CSV or XSL.
For the Starter tier, the period is 24 hours.
-
Check metrics on individual Mule apps and API implementations.
Get up to the last 90 days (Advanced and Titanium) or 30 days (other tiers) of metrics on latency, requests, responses, errors, Mule messages and the JVM for Mule apps, and for API implementations, data on policy violations, performance, and client apps from the Anyoint Insights UI. You can download most chart data to CSV or XSL.
For Advanced and Titanium tiers, the data retention period is a longer than the UI lookback window periods (see Storage and Retention.
Entities are deployable units (such as Mule apps and API implementations) that generate the data that’s displayed in Anypoint Insights.
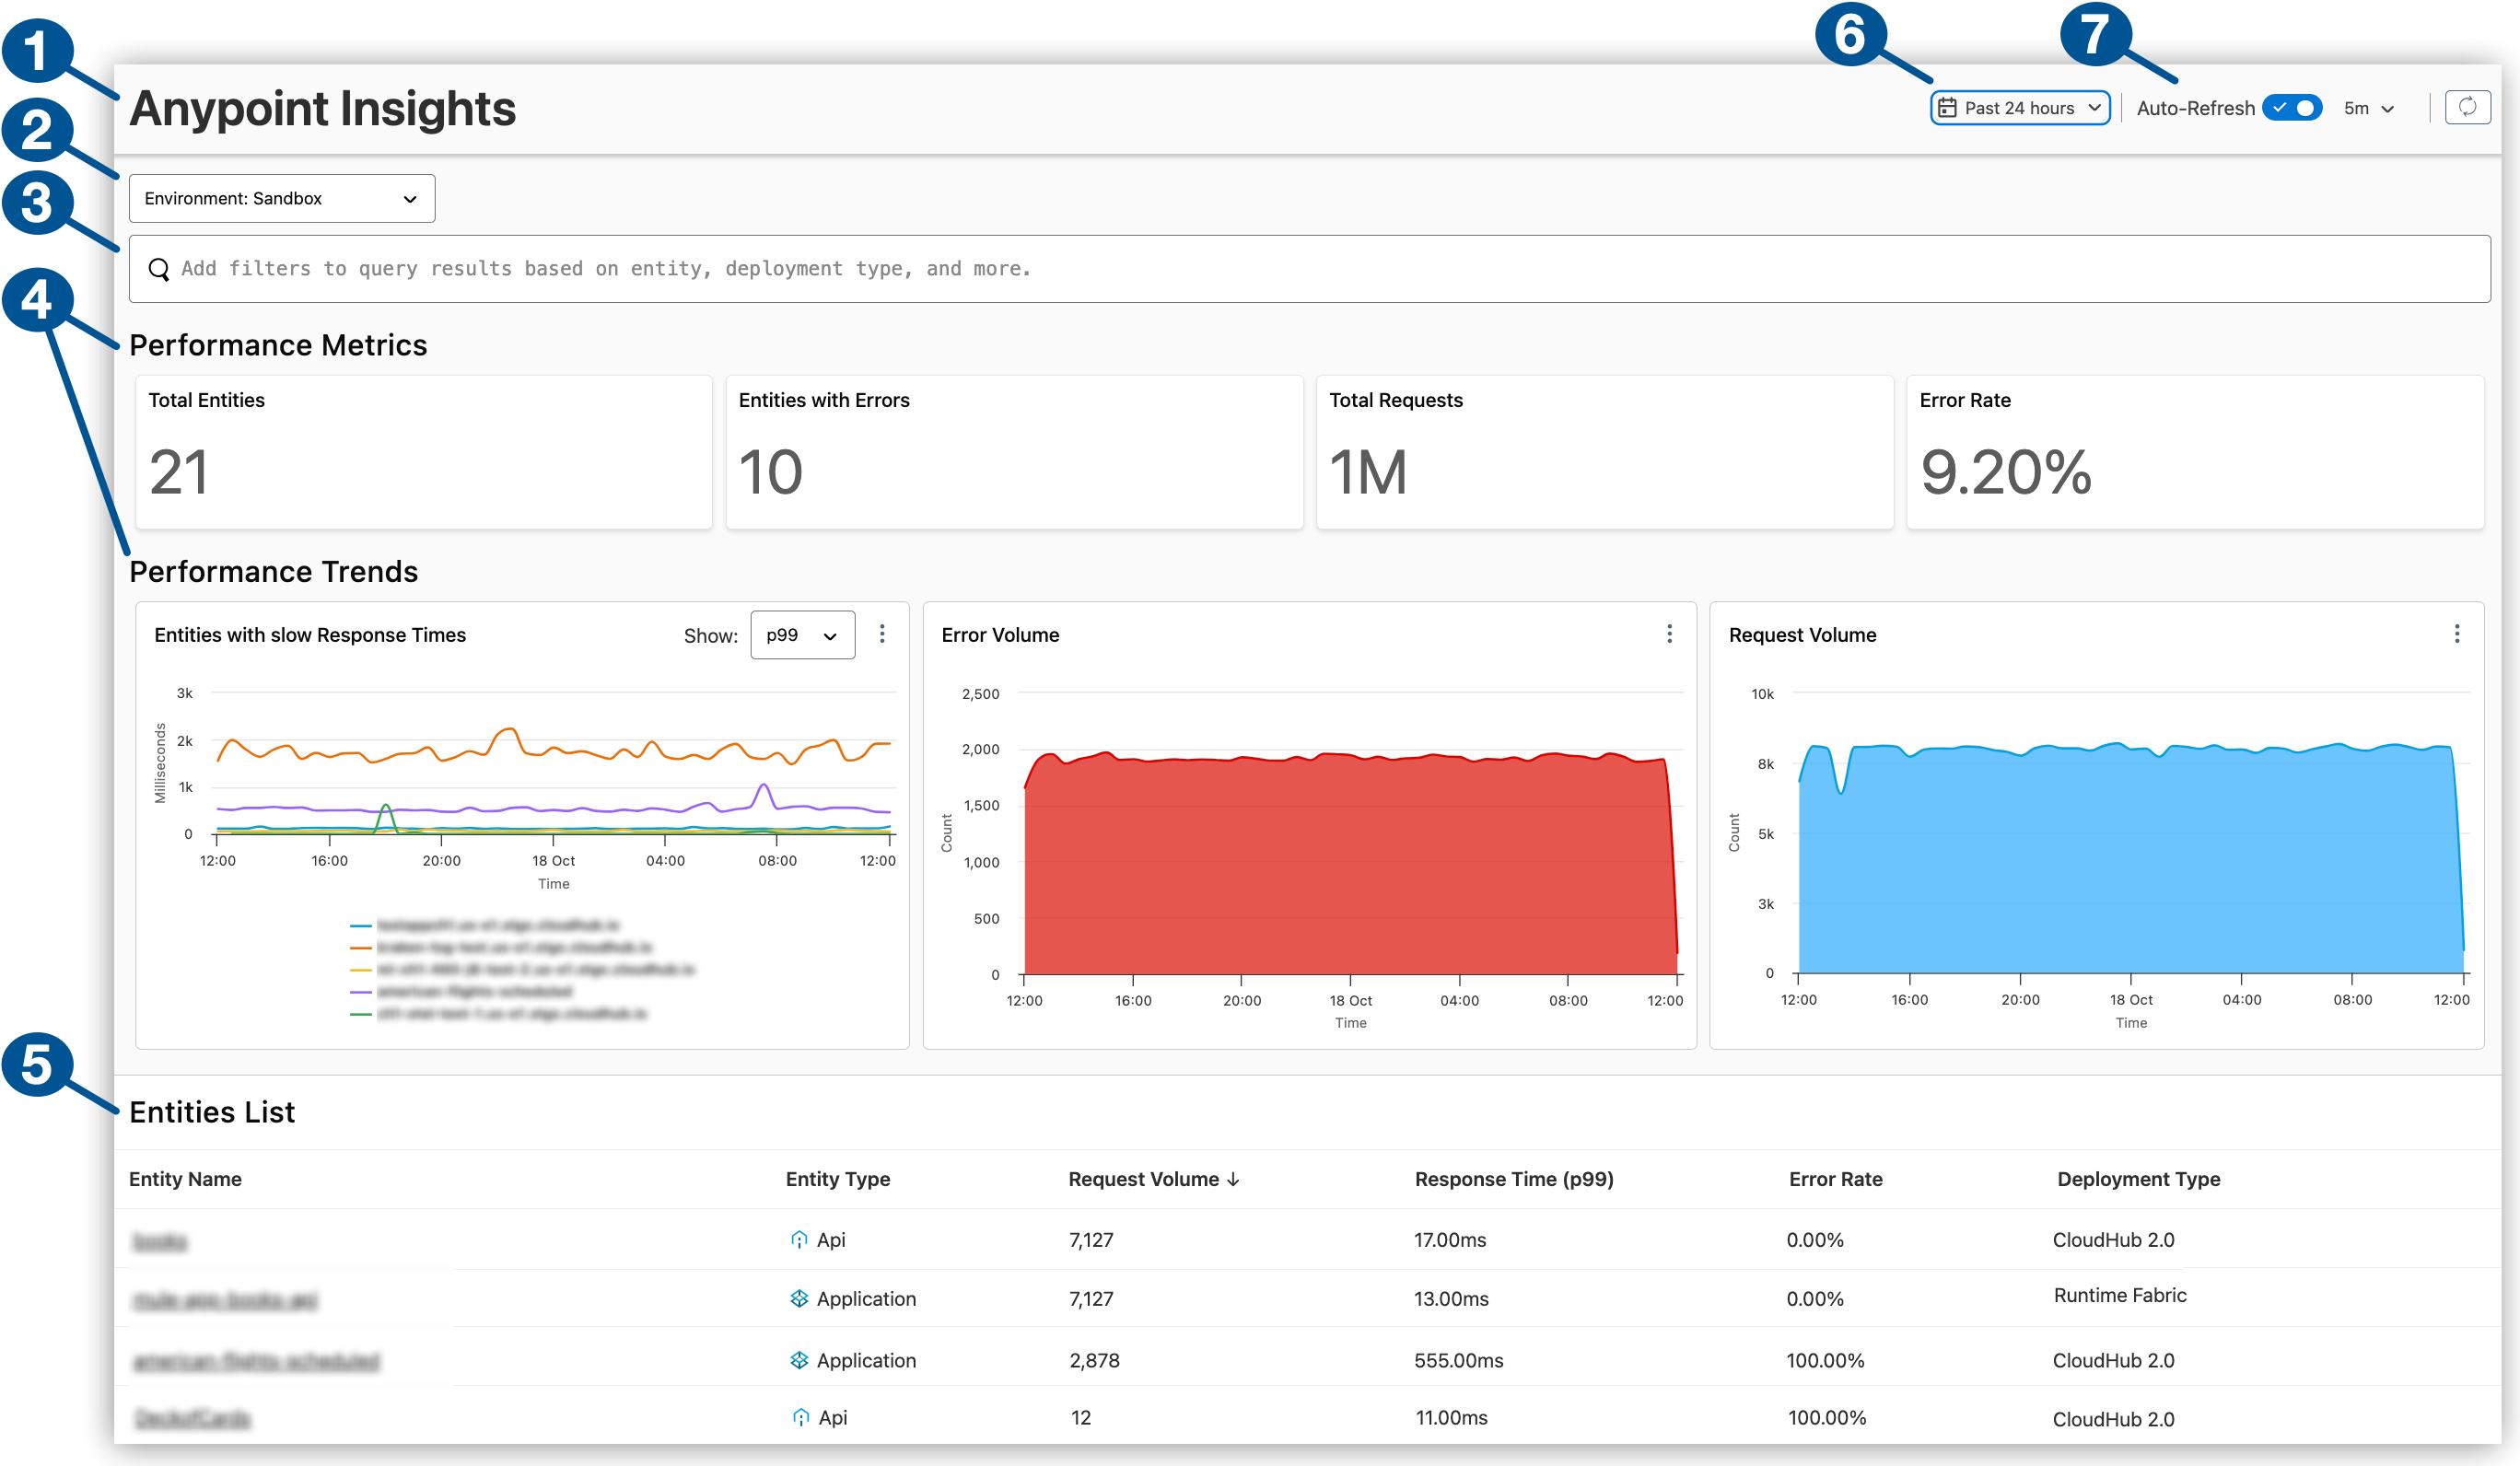
| 1 | Dashboard that provides an overview of metrics across of your deployed Mule apps and APIs |
| 2 | Environment selector for your deployments (such as Sandbox or Production) |
| 3 | Filters to narrow the data in charts |
| 4 | Performance metrics and trends across your deployed Mule apps and APIs |
| 5 | List of each Mule app and API that you can click to display detailed metrics on a specific app or API |
| 6 | Selector for the time range covered by the charts
This selector is available to all Insights dashboards. |
| 7 | Selector for auto-refresh interval, displayed when auto-refresh is enabled
This selector is available to all Insights dashboards. |
Anypoint Insights uses Anypoint Monitoring Metrics API to query for data that appears in charts. Data aggregation and retention limits in Anypoint Insights are derived from the service that supports the Metrics API. For information about data collection intervals in Anypoint Insights charts, see Data Collection Intervals in Anypoint Monitoring Charts.
For Advanced and Titanium subscription tiers, Integration Intelligence is accessible from Anypoint Insights. See Getting Long-Term Analytics with Integration Intelligence to extend your MuleSoft telemetry data analysis beyond real-time monitoring.
Before You Begin
Required prerequisites:
-
An Anypoint Platform account in a control plane that supports Anypoint Insights (see Monitoring Features by Control Plane):
-
A Mule app or API (Mule Gateway or Omni Gateway API) running on a supported version of Mule runtime engine (see Mule Runtime Release Notes) and deployed to a supported target:
-
CloudHub 2.0
-
CloudHub
-
Hybrid
-
Runtime Fabric
-
-
For Canada Cloud and Japan Cloud:
-
Enable Mule runtime access to Anypoint Platform so that you can display entity metrics in Anypoint Monitoring.
For guidance, see Configuring Mule to Access Anypoint Platform Control Planes.
-
For information about Runtime Fabric feature support in these clouds, see Features Supported on Hyperforce.
-
-
The Monitoring Viewer permission to Anypoint Monitoring and the permissions required for viewing apps and APIs (see Managing Permissions for Anypoint Monitoring)
Monitor Your Deployments
Monitor Mule apps and APIs within a selected business group and environment.
-
Meet the prerequisites in Before You Begin.
-
Log in to Anypoint Platform with a user account that has permission to access Anypoint Monitoring content.
-
Navigate to Anypoint Monitoring:
Click Monitoring from the Anypoint Platform home page or from the Runtimes menu in the header.
-
Open Anypoint Insights, and set your environment, such as Design, Production, or Sandbox.
For guidance, see Change the Environment.
-
To capture deployments for another business group you belong to in the Entities List, select the business group.
For guidance, see Change the Business Group.
-
Set the time period to capture in your charts.
For guidance, see Filter Data by Time Period.
-
Filter the deployment data to display in the charts, as needed, to focus on areas of interest.
For guidance, see Filter Deployment Data.
-
To get additional metrics for a specific app or API:
-
Find and click its name in Entities List.
Apps in the Started state and APIs in the Active state are listed.
-
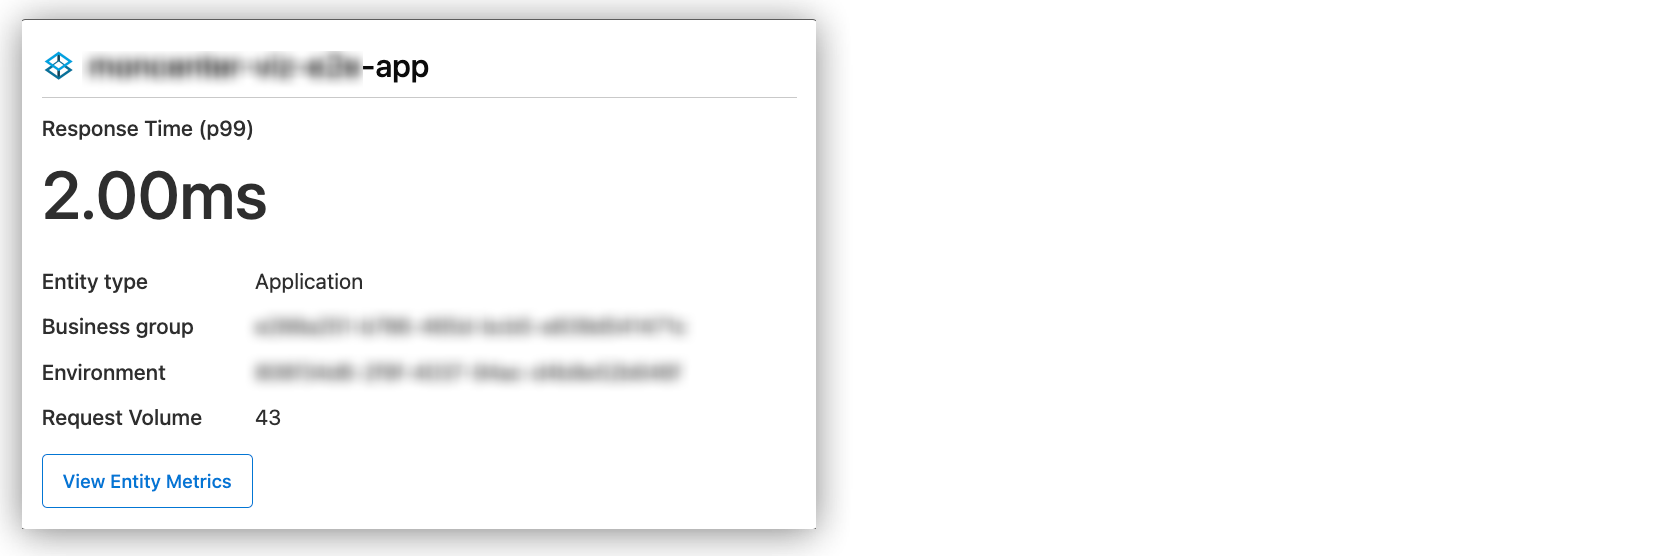
Click View Entity Metrics, for example:
-
Review metrics in the charts for the entity, for example:
-
Filter Monitoring Data Across Deployments
You can narrow the data in Anypoint Insights charts by deployment details, such as the deployment type, and by time range.
Filter Deployment Data
Use one or more filters to narrow the data in your charts. The filters support operators = and IN. Multiple filter settings are allowed. For example, this filter returns Mule apps deployed to CloudHub 2.0:
entity_type = 'APP' deployment_type = 'CLOUDHUB2'
This table lists supported filters:
| Filter | Operators | Description |
|---|---|---|
|
|
Filter by deployment target, such as CloudHub 2.0 (CLOUDHUB2) or Runtime Fabric (RTF), for example: deployment_type IN ['CLOUDHUB2', 'RTF'] |
|
|
Filter by deployment type (APP or API), for example: entity_type = 'APP'` |
|
|
Filter by specific app or API deployments, for example: entity IN ['99aea888-77de-6e06-5c55-d1234de56789', '09f99999-888d-7b77-6da5-bebd43210fc1'] |
IN captures exact matches to any comma-separated element in the array.
Filter Data by Time Period
Use the time-period selector (item 6 in the example) to show data points collected for a given time period (such as the last 15 minutes or the last 24 hours). Your setting applies across all data in Anypoint Insights overview, including items in the Entities List.
If you don’t see data on the page, check that the selected time range is correct.
Change the Environment
Charts in Anypoint Insights provide metrics on a specific environment (such as Production or Sandbox).
To change current or default environment:
-
Open Anypoint Insights from Anypoint Monitoring.
-
Set a new environment:
-
To select an environment without changing the default, use the environment selector in Anypoint Monitoring, for example:

-
To select a default environment:
-
Click your profile icon (see item 2 in the example).
-
Select the name of your profile to open Access Management Settings.
-
In Settings, select an environment as the default environment to view for the selected business group in Anypoint Monitoring, for example:

-
Return to Anypoint Monitoring to check for the new business group setting.
Refresh the page, if necessary.
-
-
Change the Business Group
Charts in Anypoint Insights display metrics for deployments in a specific business group. If you belong to more than one business group, you can change the selected group and the business group that Anypoint Monitoring selects by default.

| 1 | Business-group selector |
| 2 | User profile, for selecting defaults |
To change the business-group setting:
-
Open Anypoint Insights from Anypoint Monitoring.
-
Set a new business group:
-
To select a business group without changing the default, use the business-group selector in Anypoint Insights.
-
To select a default business group:
-
Click your profile icon (see item 2 in the example).
-
Select the name of your profile to open Access Management Settings.
-
In Access Management Settings, select a business group to use as the default, for example:
-
Return to Anypoint Monitoring to check for the new default setting.
Refresh the page, if necessary.
-
-
Download Chart Data
After opening a set of charts in Anypoint Insights, you can download metrics from charts that provide a download menu in the chart.
-
Click the
 (More menu) on a chart to open the download menu.
 -
Select the file format for your metrics:
-
Download as CSV
-
Download as XLS
-
Insights Chart Reference
Understand the monitoring data in Anypoint Insights charts:
Entities are deployable units (such as Mule apps and API implementations) that generate the data that’s displayed in Anypoint Insights.
Performance Metrics and Trends
Performance Metrics and Performance Trends provide insights across your entities:
Anypoint Insights reports transaction-level and flow-level timing for inbound and outbound endpoints, flow start and completion, and custom business events. Metrics don’t include a per-component, per-event-processor timing breakdown for every processor within a flow. For processor-level latency, use Traces or Telemetry Exporter.
Performance Metrics
Monitor high-level performance metrics across your entities. Entities are deployable units (such as Mule apps and API implementations) that generate the data that’s displayed in Anypoint Insights.
The scope of metrics depends on the selected environment, time period, and any query filters.
- Total Entities
-
Total number of entities
- Entities with Errors
-
Total number of entities that have received errors
-
For API implementations, this metric counts HTTP status codes that identify errors (for example,
404or502). -
For Mule apps, this metric counts response codes that indicate an error (for example,
FAILED).
-
- Total Requests
-
Total number of requests to the listed entities
- Error Rate
-
For entities with request errors, the percentage equal to the total number of request errors divided by the total number of requests
For example, assume that 1 out of 5 total requests to API A produces an error and that 2 requests out of 5 to App B produces an error. The error rate is 3/10, or 30%.
Performance Trends
Monitor high-level performance over time across your entities. Entities are deployable units (such as Mule apps and API implementations) that generate the data that’s displayed in Anypoint Insights.
The scope of metrics depends on the selected environment, time period, and any query filters.
- Entities with Slow Response Times
-
Response times, in milliseconds, of the entities with the slowest response times
The metric uses percentile values for response times (calculated from highest to lowest times) to identify entities with the slowest responses. You can select p99 (default), p95, p90, or p75.
- Error Volume
-
Number of errors received by the entities over time
-
For API implementations, this metric counts HTTP error codes (for example,
404or502). -
For Mule apps, this metric counts error response codes (for example,
FAILED).
-
- Request Volume
-
Number requests over time for the entities
Entities List
Check key metrics on individual Mule apps and APIs (entity), and click an entity’s name to get detailed charts for the entity. Entities are deployable units (such as Mule apps and API implementations) that generate the data that’s displayed in Anypoint Insights.
The scope of metrics depends on the selected environment, time period, and any query filters. Only entities with traffic in the selected period and business group appear in Entities List.
The list provides these metrics on entities:
- Entity Name
-
Name of the entity
- Entity Type
-
Type of entity, such as API or Application (Mule app)
- Request Volume
-
Total number of requests to this entity
- Response Time (p99)
-
Response time, in milliseconds, for the 99th percentile of requests to this entity
This response time is greater than 99% of all response times for this entity.
- Error Rate
-
Percentage of requests to this entity that resulted in errors
- Deployment Type
-
Deployment target of this entity, such as CloudHub 2.0 or Runtime Fabric
Application Details
Anypoint Monitoring provides details on individual Mule apps deployed to a supported target.
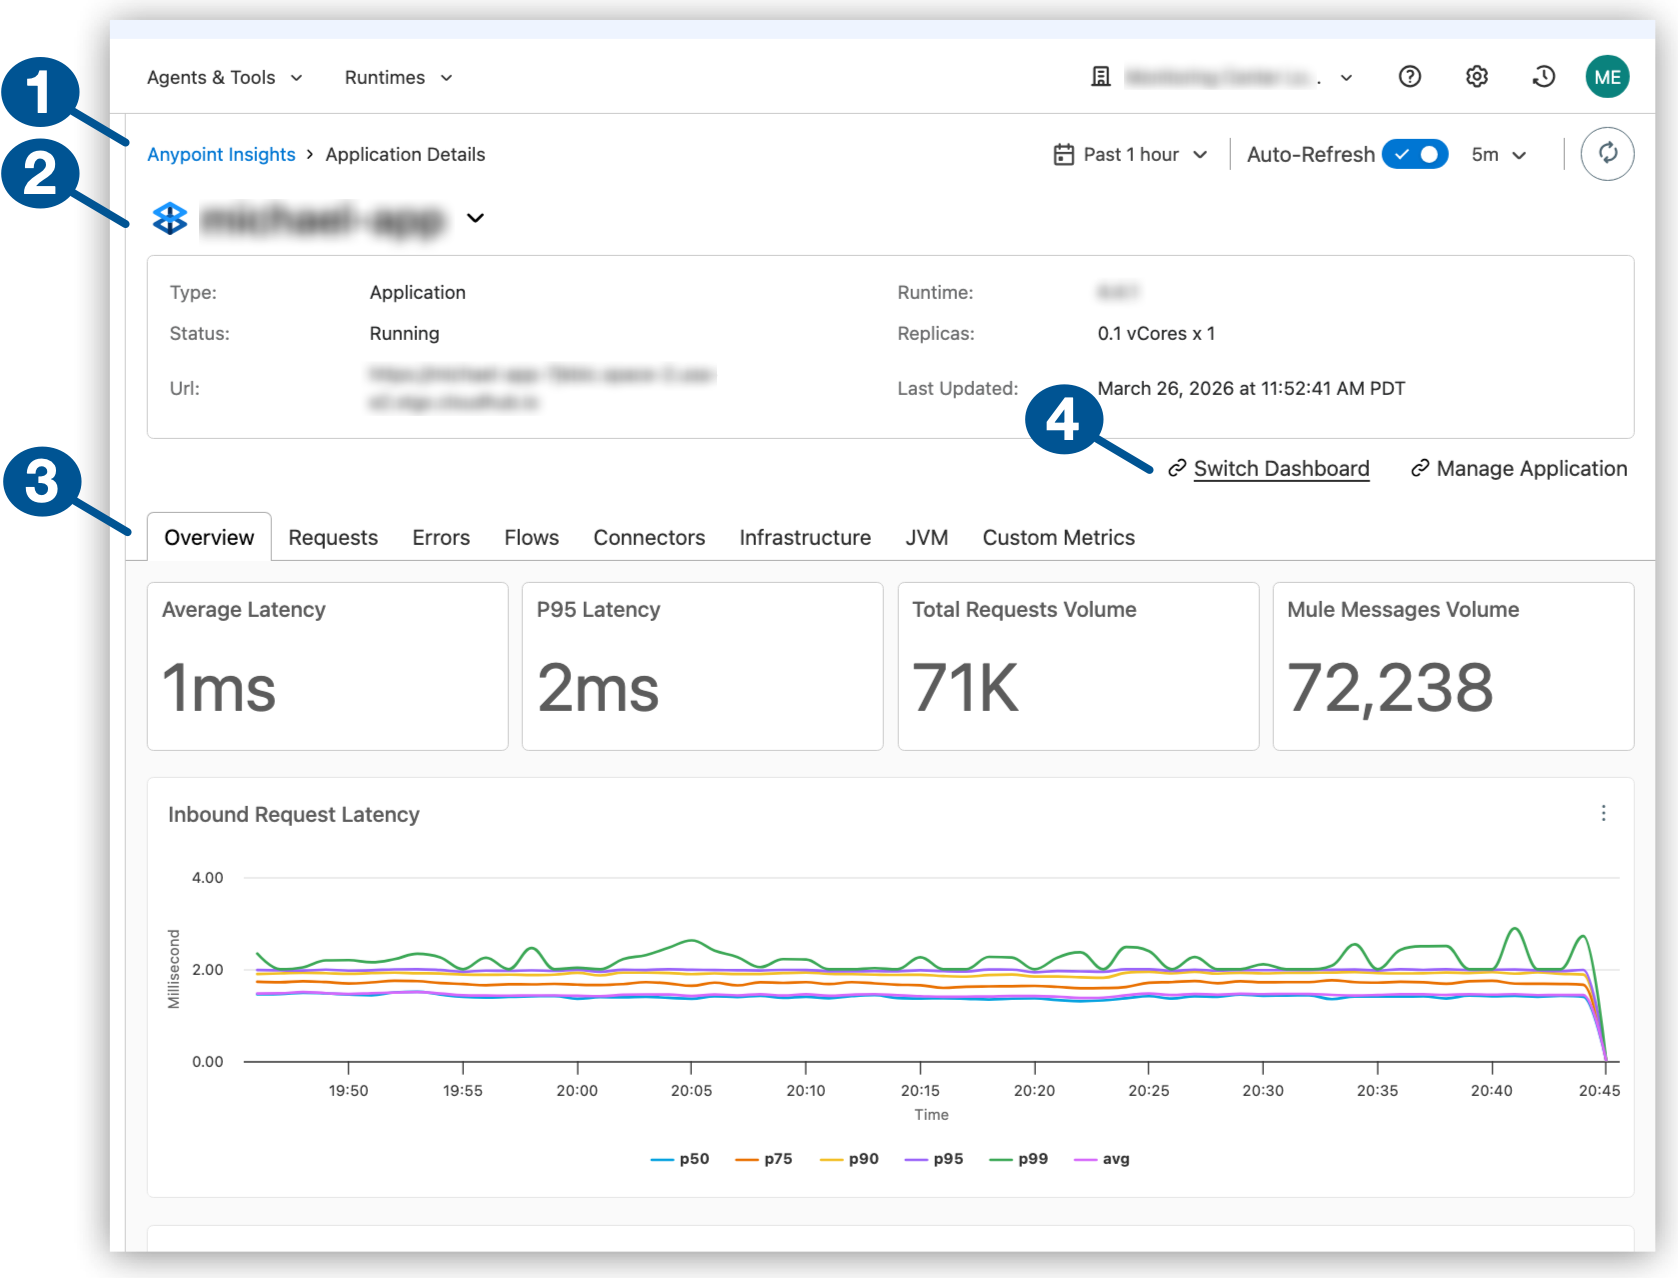
| 1 | Application Details page for an app in Anypoint Insights |
| 2 | App associated with this details page and a dropdown for opening the detail page for another app or API in one of your environments |
| 3 | Tabs containing charts and visualizations for different types of metrics on the app Get information on the charts and visualizations available for the app: |
Entities are deployable units (such as Mule apps and API implementations) that generate the data that’s displayed in Anypoint Insights.
By default, the date period in dashboards with detailed metrics on specific entities matches the time period selected for cross-entity charts in the Anypoint Insights overview.
By default, the auto-refresh interval in dashboards with detailed metrics on specific entities matches the time period interval for cross-entity charts in the Anypoint Insights overview.
Mule Application Metrics
High-level metrics are available in Application Details dashboards for individual Mule apps.
The scope of metrics depends on the selected environment, time period, and any query filters.
- Type
-
Mule app type (Application)
- Status
-
Status code that indicates whether this Mule app is running or in some other state
This code comes from Runtime Manager.
- URL
-
URL of this deployed Mule app
- Runtime
-
Mule runtime engine version of this Mule app
- Replicas
-
Virtual core fraction and count for this Mule app, for example, 0.1 vCores x 1 (= 10% of 1 vCore)
- Last Updated
-
Date-time stamp for the last update or redeployment of this Mule app
Overview Metrics for a Mule Application
Charts with overview metrics are available in the Overview tab for a Mule app in Anypoint Insights.
The scope of metrics depends on the selected environment, time period, and any query filters.
- Average Latency
-
Average latency, in milliseconds (ms), for requests to this entity
- P95 Latency
-
Latency value, in milliseconds (ms), for 95th percentile (p95) requests for this entity
- Total Requests Volume
-
Number of requests to this entity
- Mule Messages Volume
-
Total Mule message count for this app
For information about Mule messages, see Mule Event Structure.
- Inbound Request Latency
-
Latency in milliseconds of inbound requests to this app over time by percentile (p40, p75, p90, p95, p99) and average
You can download data in this chart as a CSV or XSL file.
- Inbound Request Volume
-
Number of inbound requests to this app over time grouped by protocol, response type, or ungrouped
You can download data in this chart as a CSV or XSL file.
- Failed Inbound Request Volume
-
Number of unsuccessful inbound requests over time
You can download data in this chart as a CSV or XSL file.
- Mule Messages
-
Mule message count for this Mule app over time
You can download data in this chart as a CSV or XSL file.
For information about Mule messages, see Mule Event Structure.
Request Metrics for a Mule Application
Charts with request metrics are available in the Requests tab for a Mule app in Anypoint Insights.
The scope of metrics depends on the selected environment, time period, and any query filters.
- Inbound Request Volume
-
Inbound request count total, which you can group by response time or protocol
You can download data in this chart as a CSV or XSL file.
- Outbound Request Volume
-
Outbound request count total, which you can group by response time, protocol, or by the 20 hosts (such as an Object Store or a
cloudhub.ioaddress) with the most outbound requestsYou can download data in this chart as a CSV or XSL file.
- Request Latency by Endpoint
-
Inbound or outbound latency, in milliseconds, by endpoint
The table captures the average latency and the latency value of requests at the p50, p75, p90, p95, and p99 percentiles.
- Inbound - Maximum Response Time by Endpoint
-
Maximum response time, in milliseconds, for inbound requests by endpoint
You can download data in this chart as a CSV or XSL file.
- Request Volume by Protocol
-
Number of inbound or outbound requests by protocol, such as HTTPS
- Request Volume by HTTP Endpoint
-
Number of inbound or outbound requests by HTTP endpoint
- Outbound Request Volume by Port
-
Number of outbound requests by port number, such as 443.
- Outbound Request Volume by Remote Host
-
Number of outbound requests by remote host, such as an Object Store or a
cloudhub.ioaddress.
- Outbound Request Latency
-
Outbound request latency in milliseconds, as a percentile (p50, p75, p90, p95) and an average.
You can download data in this chart as a CSV or XSL file.
- Outbound Request Volume by Operation
-
Number of requests by operation, such as a
retrieveorstoreoperation.
Error Metrics for a Mule Application
Charts with error metrics are available in the Errors tab for a Mule app in Anypoint Insights.
The scope of metrics depends on the selected environment, time period, and any query filters.
- Failed Outbound Request Volume
-
Number of failed outbound requests over time
You can download data in this chart as a CSV or XSL file.
- Top 20 Failed Requests by Total Count
-
Number of inbound or outbound requests to the 20 endpoints with the most failed requests
You can download data in this chart as a CSV or XSL file.
- Top 20 Failed Outbound Requests by Total Count
-
Number of unsuccessful outbound requests to the 20 endpoints with the most failed requests
You can download data in this chart as a CSV or XSL file.
- Inbound - Response Time by Endpoint
-
Average, minimum, and maximum response times in milliseconds for inbound requests by endpoint
- Outbound - Response Time by Endpoint
-
Average, minimum, and maximum response times in milliseconds for outbound requests by endpoint
- Inbound - Request Count by Endpoint
-
Number of inbound requests by endpoint
- Outbound - Request Count by Endpoint
-
Number of outbound requests by endpoint
- Failed Mule Messages
-
Number of failed Mule messages over time
Flow Metrics for a Mule Flow
|

Charts with error metrics are available in the Flows tab for a Mule app in Anypoint Insights.
The scope of metrics depends on the selected environment, time period, and any query filters.
- Inbound - Response Time by Flow
-
Inbound responses in milliseconds over time by app flow
You can download data in this chart as a CSV or XSL file.
- Outbound - Response Time by Flow
-
Outbound responses in milliseconds over time by app flow
You can download data in this chart as a CSV or XSL file.
- Inbound - Requests by Flow
-
Number of inbound requests over time by app flow
You can download data in this chart as a CSV or XSL file.
- Outbound - Requests by Flow
-
Number of outbound requests over time by app flow
You can download data in this chart as a CSV or XSL file.
- Failures by Flow
-
Number of failures over time by app flow
You can download data in this chart as a CSV or XSL file.
- Inbound - Response Time by Flow
-
Average, minimum, and maximum inbound response times in milliseconds by app flow
- Outbound - Response Time by Flow
-
Average, minimum, and maximum outbound response times in milliseconds by app flow
- Inbound - Requests by Flow
-
Number of inbound requests by app flow
- Outbound - Requests by Flow
-
Number of outbound requests by app flow
- Failures by Flow
-
Number of failures by app flow
Connector Metrics for a MuleSoft Connector
|
Charts with error metrics are available in the Connectors tab for a Mule app in Anypoint Insights.
The scope of metrics depends on the selected environment, time period, and any query filters.
- Connector Message Volume
-
Number of messages processed by connector over time
- Response Time by Connector
-
Response times in milliseconds by connector over time
- Salesforce Requests
-
Number of requests over time to Salesforce connector endpoints
- Salesforce Response Time
-
Response times in milliseconds for requests to Salesforce connector endpoints
- Salesforce Failures
-
Number of failed requests to Salesforce connector endpoints
- Database Requests
-
Number of requests over time to Database connector endpoints
- Database Response Time
-
Get response times in milliseconds for requests to Database connector endpoints
- Database Failures
-
Number of failed requests to Database connector endpoints
- HTTP Requests
-
Number of requests over time to HTTP connector endpoints
- HTTP Response Time
-
Response times in milliseconds for requests over time to HTTP connector endpoints
- HTTP Failures
-
Number of failed requests to HTTP connector endpoints
- Web Service Requests
-
Number of requests over time to Web Service connector endpoints
- Web Service Response Time
-
Response times in milliseconds for requests over time to Web Service connector endpoints
- Web Service Failures
-
Number of failed requests to Web Service connector endpoints
- FTP Requests
-
Number of requests over time to FTP connector endpoints
- FTP Response Time
-
Response times in milliseconds for requests over time to FTP connector endpoints
- FTP Failures
-
Number of failed requests to FTP connector endpoints
- SFTP Requests
-
Number of requests over time to SFTP connector endpoints
- SFTP Response Time
-
Response times in milliseconds for requests over time to SFTP connector endpoints
- SFTP Failures
-
Number of failed requests to SFTP connector endpoints
- SMTP Requests
-
Number of requests over time to SMTP connector endpoints
- SMTP Response Time
-
Response times in milliseconds for requests over time to SMTP connector endpoints
- SMTP Failures
-
Number of failed requests to SMTP connector endpoints
- Object Store Requests
-
Number of requests over time to Object Store connector endpoints
- Object Store Response Time
-
Response times in milliseconds for requests over time to Object Store connector endpoints
- Object Store Failures
-
Number of failed requests to Object Store connector endpoints
- Anypoint MQ Operations - Inbound
-
Number of inbound Anypoint MQ connector operations
- Anypoint MQ Response Time - Inbound
-
Inbound response times in milliseconds for requests to Anypoint MQ connector endpoints
- Anypoint MQ Failures - Inbound
-
Number of failed inbound Anypoint MQ connector operations
- Anypoint MQ Operations - Outbound
-
Number of outbound Anypoint MQ connector operations
- Anypoint MQ Response Time - Outbound
-
Outbound response times in milliseconds for requests to Anypoint MQ connector endpoints
- Anypoint MQ Failures - Outbound
-
Number of failed outbound requests to Anypoint MQ connector endpoints
- Other Connector Requests
-
Number of requests to connectors other than Salesforce, Database, HTTP, Web Service, FTP, SFTP, SMTP, Object Store, and Anypoint MQ
- Other Connector Response Time
-
Response times in milliseconds for requests to connectors other than Salesforce, Database, HTTP, Web Service, FTP, SFTP, SMTP, Object Store, and Anypoint MQ
- Other Connector Failures
-
Number of failed requests to connectors other than Salesforce, Database, HTTP, Web Service, FTP, SFTP, SMTP, Object Store, and Anypoint MQ
JVM Metrics for a Mule Application
Charts with JVM metrics are available in the JVM tab for a Mule app in Anypoint Insights.
The scope of metrics depends on the selected environment, time period, and any query filters.
- Old Gen GC Count
-
Number of times old generation Java garbage collection occurred over time
You can download data in this chart as a CSV or XSL file.
- Old Gen GC Duration
-
Amount of time in milliseconds taken for old generation Java garbage collection over time
You can download data in this chart as a CSV or XSL file.
- Young Gen GC Count
-
Number of times young generation Java garbage collection occurred over time
You can download data in this chart as a CSV or XSL file.
- Young Gen GC Duration
-
Amount of time in milliseconds taken for young generation Java garbage collection over time
You can download data in this chart as a CSV or XSL file.
- Heap Committed
-
Amount of memory the JVM guarantees to be available for the heap
You can download data in this chart as a CSV or XSL file.
- Heap Usage
-
Amount of physical memory used in MB by worker
You can download data in this chart as a CSV or XSL file.
- Thread Count
-
Number of active threads currently running in the JVM by worker
You can download data in this chart as a CSV or XSL file.
- Committed Virtual Memory
-
Amount of virtual memory the operating systems guarantees to be available for the JVM
You can download data in this chart as a CSV or XSL file.
- CPU Utilization
-
CPU work as a percentage of total CPU time
You can download data in this chart as a CSV or XSL file.
This metric reflects JVM CPU usage, not system-level CPU. It can differ from CPU values shown in systems such as CloudWatch, which measure system CPU across all processes. On Runtime Fabric, CPU is measured against the whole node rather than the pod limit, so values can appear lower than expected relative to the pod’s allocated resources.
- Classes Loaded
-
Number of Java classes loaded in the JVM by worker over time
- Classes Loaded Total
-
Number of Java classes loaded over time in the JVM by worker
- Classes Unloaded
-
Number of Java classes unloaded in the JVM by worker over time
- JVM Uptime
-
Amount of time in milliseconds that the JVM has been running
- Par Eden Space
-
Amount of memory used in the Par Eden Space, which is part of the heap used for young generation garbage collection. Select metrics on this data by space used, initial size, committed size, or maximum size.
- G1 Eden Space
-
Get the amount of memory used in the G1 Eden Space, which is part of the heap used for young generation garbage collection. Select metrics on this data by space used, initial size, committed size, or maximum size.
- Par Survivor Space
-
Amount of memory used in the Par Survivor Space, which is part of the heap used for young generation garbage collection. Select metrics on this data by space used, initial size, committed size, or maximum size.
- G1 Survivor Space
-
Amount of memory used in the G1 Survivor Space, which is part of the heap used for young generation garbage collection. Select metrics on this data by space used, initial size, committed size, or maximum size.
- Metaspace
-
Megabytes (MB) of memory used in the Metaspace by worker. Metaspace is memory used for class metadata. Select metrics on this data by space used, initial size, committed size, or maximum size.
- Compressed Class Space
-
Megabytes (MB) of memory used in the Compressed Class Space by worker. Compressed Class Space is memory used for class metadata for 64-bit JVMs with compressed object pointers. Select metrics on this data by space used, initial size, committed size, or maximum size.
- JVM Memory Code Cache
-
Megabytes (MB) of memory used in the JVM Code Cache by worker. JVM Code Cache is memory used for compilation and storage of Java bytecode. Select metrics on this data by space used, initial size, committed size, or maximum size.
- Code Cache
-
Megabytes (MB) of memory for Code Cache by worker. Code Cache is memory used for compilation and storage of Java bytecode. Select metrics on this data by space used, initial size, committed size, or maximum size.
- Tenured Gen
-
Megabytes (MB) of memory for Tenured Generation by worker. Tenured Generation is part of the heap used for old generation garbage collection. Select metrics on this data by space used, initial size, committed size, or maximum size.
- G1 Old Gen
-
Megabytes (MB) of memory for G1 Old Generation by worker. G1 Old Generation is part of the heap used for old generation garbage collection. Select metrics on this data by space used, initial size, committed size, or maximum size.
Infrastructure Metrics for a Mule Application
Charts with infrastructure metrics are available in the Infrastructure tab for a Mule app in Anypoint Insights.
The scope of metrics depends on the selected environment, time period, and any query filters.
- Total System Processors
-
Number of processors available to the JVM on the host system
- Total System Memory
-
Total physical memory available on the host system, in bytes
- Free System Memory
-
Amount of free physical memory on the host system, in bytes
- System CPU % Utilization
-
CPU utilization as a percentage of total system CPU across all processes on the host
This metric measures system-level CPU, not JVM CPU. It can differ from the CPU Utilization chart in the JVM tab, which measures only JVM CPU usage.
- JVM - CPU Time
-
Cumulative CPU time consumed by the JVM, in nanoseconds
- Total Swap Space
-
Total swap space available on the host system, in bytes
- Free Swap Space
-
Amount of free swap space on the host system, in bytes
Custom Metrics for a Mule Application
|
Monitor apps that use your organization’s custom metrics for a Mule app. Adjust settings of the charts that use your custom metrics.
Before You Begin
Meet subscription tier and Mule runtime version requirements:
The Custom Metrics tab for an app appears in Anypoint Insights only if your organization has the Anypoint Integration Advanced package or a Titanium subscription to Anypoint Platform and the app you selected is running on a supported version of Mule.
Create Custom Metrics
To create custom metrics, use the Anypoint Custom Metrics Connector in your app flow to collect metrics for your business and operational needs. After you deploy your app, your defined custom metrics charts appear in this tab. For guidance using the Anypoint Custom Metrics Connector, see Creating Custom Metrics.
Configure Custom Metrics Charts
To adjust the custom metrics settings of a Mule app chart in Anypoint Insights:
-
From a Mule app listed in Anypoint Insights, click the Custom Metrics tab.
-
Select a value for these fields, and then click Apply to update the chart:
-
Aggregations values include:
-
None (Default) - Performs no data aggregation.
-
count - Displays the total number of items collected for the measurement.
-
distinct - Returns the unique values for the given measurement.
-
integral - Returns the area under the curve for subsequent values.
-
mean - Returns the arithmetic average of the specified measurement over a given interval of time.
-
median - Displays the middle value for the collected metrics.
-
mode - Displays the most frequent value in the metrics collected for the defined measurement.
-
sum - Displays the sum of all the values for the defined measurement.
-
-
Measurement: These options are determined by the measurement values you define in the Custom Metrics connector.
-
Dimensions: The choices in this list are determined by the values you define in the Custom Metrics connector.
-
API Details
Anypoint Monitoring provides details on individual API implementations deployed to a supported target.
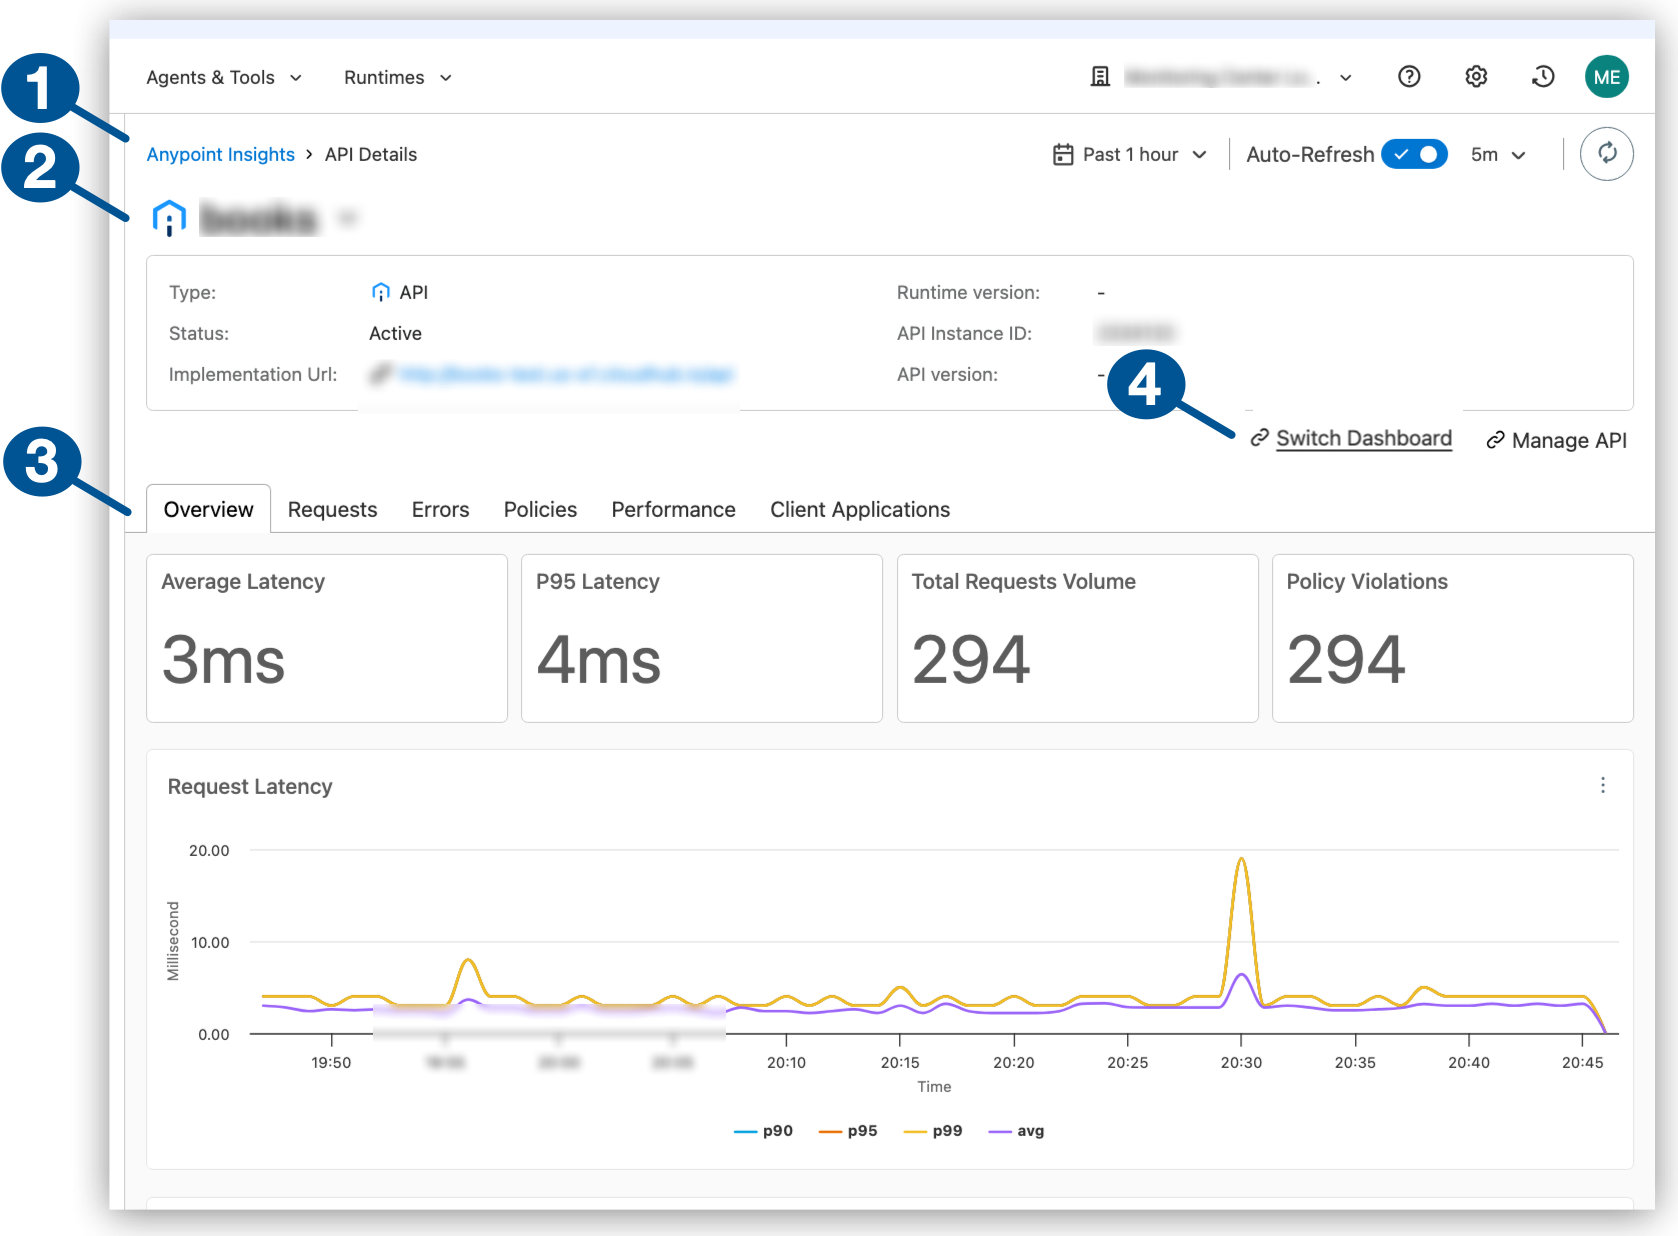
| 1 | API Details page for an API in Anypoint Insights |
| 2 | API associated with this details page and a dropdown for opening the detail page for another API or app in one of your environments |
| 3 | Tabs containing charts and visualizations for different types of metrics on the API Get information on the charts and visualizations available for the API: |
Entities are deployable units (such as Mule apps and API implementations) that generate the data that’s displayed in Anypoint Insights.
By default, the date period in dashboards with detailed metrics on specific entities matches the time period selected for cross-entity charts in the Anypoint Insights overview.
By default, the auto-refresh interval in dashboards with detailed metrics on specific entities matches the time period interval for cross-entity charts in the Anypoint Insights overview.
API Implementation Metrics
High-level metrics are available in API Details dashboards for individual API implementations.
The scope of metrics depends on the selected environment, time period, and any query filters.
- Type
-
API implementation type (API)
- Status
-
Status code that indicates whether the governance policies and SLA tiers are functional (Active) or not
For all codes, see information about tracking registration status in the API Manager documentation.
- Implementation URL
-
URL of deployed API integration
- Runtime Version
-
Mule Gateway or Omni Gateway (formerly Flex Gateway) runtime version used by the API implementation
- API Instance ID
-
Instance identifier for an API implementation incorporated into an Omni Gateway (formerly Flex Gateway) or API Gateway runtime
- API Version
-
Version of the API implementation
For more information, see Managing Instances.
Overview Metrics for an API Implementation
Charts with overview metrics are available in the Overview tab for each API implementation that you can monitor in Anypoint Insights.
The scope of metrics depends on the selected environment, time period, and any query filters.
- Average Latency
-
Average latency, in milliseconds (ms), for requests to this entity
- P95 Latency
-
Latency value, in milliseconds (ms), for 95th percentile (p95) requests for this entity
- Total Requests Volume
-
Number of requests to this entity
- Policy Violations
-
Number of requests rejected because of API policy violations
- Request Latency
-
Latency, in milliseconds, for requests to this API over time
The chart provides values for the average latency and the p90, p95, p99 percentiles.
You can download data in this chart as a CSV or XSL file.
- Request Volume
-
Number of requests to this API over time
You can download data in this chart as a CSV or XSL file.
- Failed Requests
-
Number of unsuccessful requests to this API over time
You can download data in this chart as a CSV or XSL file.
- Total 4xx Errors
-
Number of requests to this API over time that resulted in a 4xx response code.
- Total 5xx Errors
-
Number of requests to this API over time that resulted in a 5xx response code.
- Policy Violations
-
Number of requests rejected over time because of API policy violations
For information about policies, see Gateway Policies in API Manager.
You can download data in this chart as a CSV or XSL file.
Request Metrics for an API Implementation
Charts with request metrics are available in the Requests tab for each API implementation that you can monitor in Anypoint Insights.
The scope of metrics depends on the selected environment, time period, and any query filters.
- Request Volume by HTTP Method
-
Number of requests over time, grouped by the HTTP method used for the request
You can download data in this chart as a CSV or XSL file.
- Request Volume by Response Code
-
Number of requests over time, grouped by the response code (such as 2xx)
You can download data in this chart as a CSV or XSL file.
- Request Volume by Top N paths
-
Number of requests from the 20 endpoints with the most requests
You can download data in this chart as a CSV or XSL file.
Error Metrics for an API Implementation
Charts with error metrics are available in the Errors tab for each API implementation that you can monitor in Anypoint Insights.
The scope of metrics depends on the selected environment, time period, and any query filters.
- Failed Requests Volume by HTTP Method
-
Number of unsuccessful requests over time, grouped by the HTTP method used
You can download data in this chart as a CSV or XSL file.
- Failed Requests Volume by Response Code
-
Number of unsuccessful requests over time, grouped by the response code (such as 2xx)
You can download data in this chart as a CSV or XSL file.
- Failed Requests by Top N Paths
-
Number of unsuccessful requests over time from the 20 endpoints with the most requests
You can download data in this chart as a CSV or XSL file.
Policy Metrics for an API Implementation
Charts with policy metrics are available in the Policies tab for each API implementation that you can monitor in Anypoint Insights.
The scope of metrics depends on the selected environment, time period, and any query filters.
- Policy Violations by Path
-
Number of requests rejected over time because of API policy violations, grouped by endpoint. Data retention is 1 hour.
For information about policies, see xref:api-manager::manage-policies-overview.adoc
- Policy Violations by Outcome
-
Number of requests rejected over time because of API policy violations, grouped by outcome (such as Blocked or Alerted). Data retention is 1 hour.
- Policy Violations by Policy
-
Number of requests rejected over time because of API policy violations, grouped by the specific policy that was violated. Data retention is 1 hour.
Performance Metrics for an API Implementation
Charts with performance metrics are available in the Performance tab for each API implementation that you can monitor in Anypoint Insights.
The scope of metrics depends on the selected environment, time period, and any query filters.
- Top 20 Paths by Average Response Time
-
Average response time of the 20 most requested endpoints
You can download data in this chart as a CSV or XSL file.
- Top 20 Paths by 95th Percentile Response Time
-
95th percentile value for each of the 20 most requested endpoints
You can download data in this chart as a CSV or XSL file.
- Request Latency by Endpoint
-
Latency, in milliseconds, by endpoint. Get the average, minimum, and maximum latency for requests to each endpoint.
Client Application Metrics for an API Implementation
Charts with client app metrics are available in the Client Applications tab for each API implementation that you can monitor in Anypoint Insights.
The scope of metrics depends on the selected environment, time period, and any query filters.
- Request Volume by Location
-
Map visualization with the number of requests in geographic areas across the globe. Review location-specific data by client ID and Client IP. Data retention is 1 hour.
You can click the request volume number on the map to get more detailed information.
- Requests by Client ID
-
Number of requests by client ID
- Requests by Client IP
-
Number of requests by client IP
Data Collection Intervals in Anypoint Monitoring Charts
Anypoint Monitoring charts display data in configurable date-time ranges, which include the last 15 minutes, hour, week, a custom date-time range, and other periods.
Data Points in Anypoint Monitoring Charts
Anypoint Monitoring charts aggregate data into data points along a horizontal Time axis. If the time units for data in your charts are larger or smaller than you require, try narrowing or expanding the time range that your charts capture. Alternatively, you can use the Metrics API to aggregate data within the API’s limits.
To make sure charts are plotted continuously, average response time charts use a straight line to connect the last data point before an app or API goes inactive with the next data point. To understand activity in average response time charts, review related charts, such as request counts, for a complete picture of your app or API’s activity.
How Anypoint Monitoring Collects Metrics
The Anypoint Monitoring agent collects and aggregates metrics on a per-minute basis, so one minute is the shortest possible time increment you can examine in dashboards for your deployments. Metrics collection begins at a random second of that minute, and collection repeats at the same second in subsequent minutes. For example, if the agent collects metrics at 12:00:15, it collects them again at 12:01:15, 12:02:15, and so on.
Within a Mule app, metrics for calls made to and from a connector start on different seconds. For example, metrics for inbound calls to port 8080 might be collected at 12:00:45, 12:01:45, and 12:02:45, while metrics for outbound calls made to an endpoint might be collected at 12:00:23, 12:01:23, and 12:02:23. Because inbound call metrics collection occurs at different seconds during a minute than call metrics for outbound calls, the total number of inbound and outbound calls reported during any minute might vary. For example, if app A reports ten outbound calls made at 12:05, app B might report that the total number of corresponding inbound calls is split between 12:04 and 12:05, or 12:05 and 12:06 time windows (namely, 12:04 reports four calls and 12:05 reports six calls, totaling the ten calls).
Metrics API
|
Anypoint Insights uses Anypoint Monitoring Metrics API to submit queries for data used in charts. You can use this API to query data for your needs.
Age-based data aggregation limits determine the minimum intervals available for retrieving metrics data:
-
Data less than or equal to 7 days old is available at a minimum of 1-minute intervals.
-
Data over 7 days old is available at a minimum of 5-minute intervals.
To use the API and get information about data retention, see the API documentation on Anypoint Exchange: Anypoint Monitoring Metrics API
Queries can return empty data (200 OK with no results) if the Connected App lacks the required environment-level permissions.
Also, the endpoint.type and endpoint.operation attributes are no longer valid on the mulesoft.api.summary metric.
For details and workarounds, see Why does my Metrics API query return empty data? and What attributes should I use to query application traffic data?
|
Chart Mapping from Built-in Dashboards
If you previously used built-in dashboards in Anypoint Monitoring, use these tables to find the equivalent charts in Anypoint Insights.
Mule App Charts
| Built-in Dashboard Tab for an App | Built-in Dashboard Chart | Anypoint Insights Tab for an App | Anypoint Insights Chart |
|---|---|---|---|
Overview |
Mule Messages |
Mule Messages |
|
Inbound - Average Response Time |
Inbound Request Latency (Displays avg) |
||
Errors |
Failed Mule Messages |
||
Inbound - Total Requests by Response Type |
Inbound Request Volume (Select By Response Type) |
||
Outbound - Total Requests by Response Type |
Outbound Request Volume (Select By Response Type) |
||
Outbound - Average Response Time |
Outbound Request Latency (Select avg) |
||
JVM - CPU % Utilization |
CPU Utilization |
||
JVM - Heap Used |
Heap Usage |
||
JVM - Thread Count |
Thread Count |
||
Inbound |
Inbound - Total Requests by Response Type |
Inbound Request Volume (Select By Response Type) |
|
Inbound - Average Response Time by HTTP Endpoint |
Request Latency by Endpoint (Select Inbound, Displays Average) |
||
Inbound - Min Response Time by HTTP Endpoint |
Request Latency by Endpoint (Select Inbound, Displays Min) |
||
Inbound - Max Response Time by HTTP Endpoint |
Request Latency by Endpoint (Select Inbound, Displays Max) |
||
Inbound - Total Requests by HTTP Endpoint |
Request Volume by HTTP Endpoint (Select Inbound) |
||
Inbound - Maximum Response Time |
Inbound - Maximum Response Time by Endpoint |
||
Inbound - Protocols |
Request Volume by Protocol (Select Inbound ) |
||
Inbound - HTTP Endpoints |
Request Volume by HTTP Endpoint |
||
Inbound - Average Response Time |
Inbound Request Latency (Select avg) |
||
Inbound - Response Time - 99 Percentile |
Inbound Request Latency (Displays p99) |
||
Inbound - Response Time - 90 Percentile |
Inbound Request Latency (Displays p90) |
||
Inbound - Response Time - 75 Percentile |
Inbound Request Latency (Displays p75) |
||
Inbound - Response Time - 50 Percentile |
Inbound Request Latency (Displays p50) |
||
Inbound - Failure Total Request Count |
Failed Inbound Request Volume |
||
Outbound |
Outbound - Average Response Time |
Outbound Request Latency (Displays avg) |
|
Outbound - Total Requests by Response Type |
Outbound Request Volume (Select By Response Type) |
||
Outbound - Average Response Time by Endpoint |
Request Latency by Endpoint (Select Outbound, Displays Average) |
||
Outbound - Min Response Time by Endpoint |
Request Latency by Endpoint (Select Outbound, Displays Min) |
||
Outbound - Max Response Time by Endpoint |
Request Latency by Endpoint (Select Outbound, Displays Max) |
||
Outbound - Total Requests by HTTP Endpoint |
Request Volume by HTTP Endpoint (Select Outbound) |
||
Outbound - Response Time - 99 Percentile |
Outbound Request Latency (Displays p99) |
||
Outbound - Response Time - 90 Percentile |
Outbound Request Latency (Displays p90) |
||
Outbound - Response Time - 75 Percentile |
Outbound Request Latency (Displays p75) |
||
Outbound - Response Time - 50 Percentile |
Outbound Request Latency (Displays p50) |
||
Outbound - Failure Total Request Count |
Failed Outbound Request Volume |
||
Outbound - HTTP Ports |
Outbound Request Volume by Port |
||
Outbound - Operations |
Outbound Request Volume by Operation |
||
Outbound - HTTP Protocols |
Request Volume by Protocol (Select Outbound) |
||
Outbound - Endpoints |
Outbound Request Volume by Remote Host |
||
Failures |
Errors |
Failed Mule Messages |
|
Inbound - Failure Total Request Count |
Top 20 Failed Requests by Total Count (Select Inbound) |
||
Outbound - Failure Total Request Count |
Top 20 Failed Outbound Requests by Total Count |
||
Inbound - Total Requests by Response Type |
Inbound Request Volume (Select By Response Type) |
||
Outbound - Total Requests by Response Type |
Outbound Request Volume (Select By Response Type) |
||
Inbound - Failure Response Time by Endpoint |
Inbound - Response Time by Endpoint |
||
Inbound - Failure Total Request Count by Endpoint |
Inbound - Request Count by Endpoint |
||
Outbound - Failure Response Time by Endpoint |
Outbound - Response Time by Endpoint |
||
Outbound - Failure Total Request Count by Endpoint |
Outbound - Request Count by Endpoint |
||
Performance |
Mule Messages |
Mule Messages |
|
Average Response Time |
Inbound Request Latency (Displays avg) |
||
Inbound - Average Response Time |
Inbound Request Latency (Displays avg) |
||
Inbound - Response Time by Endpoint |
Request Latency by Endpoint (Select Inbound) |
||
Inbound - Response Time Percentiles |
Inbound Request Latency (Displays p99, p90, p75, p50) |
||
Outbound - Average Response Time |
Outbound Request Latency (Displays avg) |
||
Outbound - Response Time by Endpoint |
Request Latency by Endpoint (Select Outbound) |
||
Outbound - Response Time Percentiles |
Outbound Request Latency (Displays p99, p90, p75, p50) |
||
Flows |
Inbound - Response Time by Flow |
Inbound - Response Time by Flow |
|
Outbound - Response Time by Flow |
Outbound - Response Time by Flow |
||
Inbound - Requests by Flow |
Inbound - Requests by Flow |
||
Outbound - Requests by Flow |
Outbound - Requests by Flow |
||
Failures by Flow |
Failures by Flow |
||
Connectors |
Connector Message Volume |
Connector Message Volume |
|
Response Time by Connector |
Response Time by Connector |
||
Salesforce Requests |
Salesforce Requests |
||
Salesforce Response Time |
Salesforce Response Time |
||
Salesforce Failures |
Salesforce Failures |
||
Database Requests |
Database Requests |
||
Database Response Time |
Database Response Time |
||
Database Failures |
Database Failures |
||
HTTP Requests |
HTTP Requests |
||
HTTP Response Time |
HTTP Response Time |
||
HTTP Failures |
HTTP Failures |
||
Web Services Requests |
Web Services Requests |
||
Web Services Response Time |
Web Services Response Time |
||
Web Services Failures |
Web Services Failures |
||
FTP Requests |
FTP Requests |
||
FTP Response Time |
FTP Response Time |
||
FTP Failures |
FTP Failures |
||
SFTP Requests |
SFTP Requests |
||
SFTP Response Time |
SFTP Response Time |
||
SFTP Failures |
SFTP Failures |
||
SMTP Requests |
SMTP Requests |
||
SMTP Response Time |
SMTP Response Time |
||
SMTP Failures |
SMTP Failures |
||
Object Store Requests |
Object Store Requests |
||
Object Store Response Time |
Object Store Response Time |
||
Object Store Failures |
Object Store Failures |
||
Anypoint MQ Operations - Inbound |
Anypoint MQ Operations - Inbound |
||
Anypoint MQ Response Time - Inbound |
Anypoint MQ Response Time - Inbound |
||
Anypoint MQ Failures - Inbound |
Anypoint MQ Failures - Inbound |
||
Anypoint MQ Operations - Outbound |
Anypoint MQ Operations - Outbound |
||
Anypoint MQ Response Time - Outbound |
Anypoint MQ Response Time - Outbound |
||
Anypoint MQ Failures - Outbound |
Anypoint MQ Failures - Outbound |
||
Other Connector Requests |
Other Connector Requests |
||
Other Connector Response Time |
Other Connector Response Time |
||
Other Connector Failures |
Other Connector Failures |
||
JVM |
Old Gen GC Count |
Old Gen GC Count |
|
Old Gen GC Time |
Old Gen GC Duration |
||
Young Gen GC Count |
Young Gen GC Count |
||
Young Gen GC Time |
Young Gen GC Duration |
||
Classes Loaded |
Classes Loaded |
||
Classes Loaded Total |
Classes Loaded Total |
||
Classes Unloaded |
Classes Unloaded |
||
Heap Committed |
Heap Committed |
||
Heap Used |
Heap Usage |
||
Thread Count |
Thread Count |
||
Eden Space Used |
Par Eden Space (Select Used) |
||
Eden Space Max |
Par Eden Space (Select Max) |
||
Eden Space Init |
Par Eden Space (Select Init) |
||
Eden Space Committed |
Par Eden Space (Select Committed) |
||
Survivor Space Used |
Par Survivor Space and G1 Survivor Space (Select Used) |
||
Survivor Space Max |
Par Survivor Space and G1 Survivor Space (Select Max) |
||
Survivor Space Init |
Par Survivor Space and G1 Survivor Space (Select Init) |
||
Survivor Space Committed |
Par Survivor Space and G1 Survivor Space (Select Committed) |
||
Metaspace Used |
Metaspace (Select Used) |
||
Metaspace Max |
Metaspace (Select Max) |
||
Metaspace Init |
Metaspace (Select Init) |
||
Metaspace Committed |
Metaspace (Select Committed) |
||
Code Cache Used |
Code Cache (Select Used) |
||
Code Cache Max |
Code Cache (Select Max) |
||
Code Cache Init |
Code Cache (Select Init) |
||
Code Cache Committed |
Code Cache (Select Committed) |
||
Compressed Class Space Used |
Compressed Class Space (Select Used) |
||
Compressed Class Space Max |
Compressed Class Space (Select Max) |
||
Compressed Class Space Init |
Compressed Class Space (Select Init) |
||
Compressed Class Space Committed |
Compressed Class Space (Select Committed) |
||
Old Gen Mem Used |
Tenured Gen, G1 Old Gen charts (Select Used) |
||
Old Gen Mem Max |
Tenured Gen, G1 Old Gen charts (Select Max) |
||
Old Gen Mem Init |
Tenured Gen, G1 Old Gen charts (Select Init) |
||
Old Gen Mem Committed |
Tenured Gen, G1 Old Gen charts (Select Committed) |
||
Committed Virtual Memory |
Committed Virtual Memory |
||
Infrastructure |
JVM - CPU % Utilization |
CPU Utilization |
|
JVM - Heap Used |
Heap Usage |
||
JVM Thread Count |
Thread Count |
||
Total System Processors |
Total System Processors |
||
System Memory |
Total System Memory and Free System Memory |
||
System CPU % Utilization |
System CPU % Utilization |
||
JVM CPU Time |
JVM - CPU Time |
||
Operating System Swap Space |
Total Swap Space and Free Swap Space |
||
Application Network |
App network visualization |
No equivalent in Anypoint Insights. Use API Visualizer (formerly Anypoint Visualizer) to visualize app network data. |
|
Custom Metrics |
Charts |
Charts that use your organization’s custom metrics. |
|
API Charts
| Built-in Dashboard Tab for an API | Built-in Dashboard Chart | Anypoint Insights Tab for an API | Anypoint Insights Chart |
|---|---|---|---|
Overview |
Requests Volume |
Request Volume |
|
Failed Requests |
Failed Requests |
||
Total 4xx Errors |
Total 4xx Errors |
||
Total 5xx Errors |
Total 5xx Errors |
||
Policy Violations |
Policy Violations |
||
Average Response Time |
Request Latency (Displays avg) |
||
Requests |
Requests grouped by top 20 paths |
Request Volume by Top 20 Paths |
|
Requests by Method |
Request Volume by HTTP Method |
||
Requests by Response Code |
Request Volume by Response Code |
||
Failures |
Failures by top 20 paths |
Failed Requests by Top 20 Paths |
|
Failures by Method |
Failed Requests Volume by HTTP Method |
||
Failures by Response Code |
Failed Requests Volume by Response Code |
||
Policies |
Policy Violations by Path |
Policy Violations by Path |
|
Policy Violations by Outcome |
Policy Violations by Outcome |
||
Policy Violations by Violation ID |
Policy Violations by Policy |
||
Performance |
Requests by Performance |
Request Latency by Endpoint |
|
Client Applications |
Requests by ClientID |
Requests by Client ID |
|
Requests by Client IP |
Requests by Client IP |
||
Requests by Location |
Request Volume by Location (1-hour data retention) |