
Setting Up Custom Dashboards

Create and configure custom dashboards in Anypoint Monitoring to visualize the metrics that matter most for your Mule apps and APIs.
View a Custom Dashboard
Find and open a custom dashboard in Anypoint Monitoring.
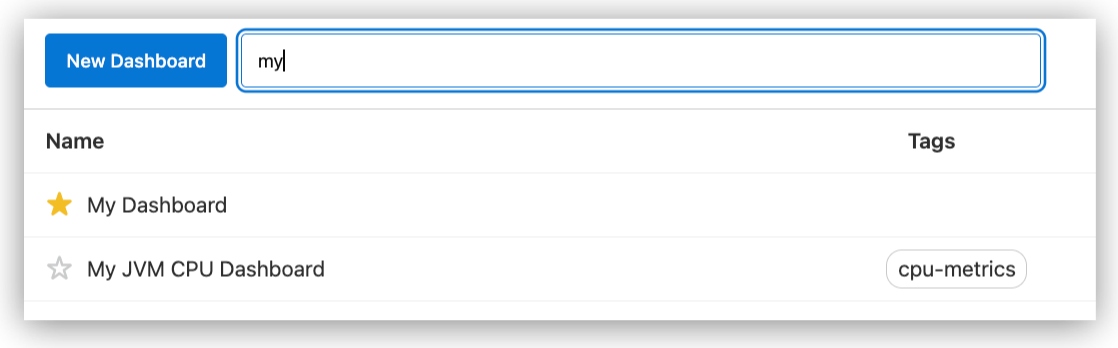
To view a custom dashboard:
-
Navigate to Anypoint Monitoring:
Click Monitoring from the Anypoint Platform home page or from the Runtimes menu in the header.
-
In the sidebar, click Custom Dashboards to display custom dashboards.
-
Search for a custom dashboard by name or tag.
-
Click a name in the list to open the custom dashboard.
Custom dashboards share common properties:
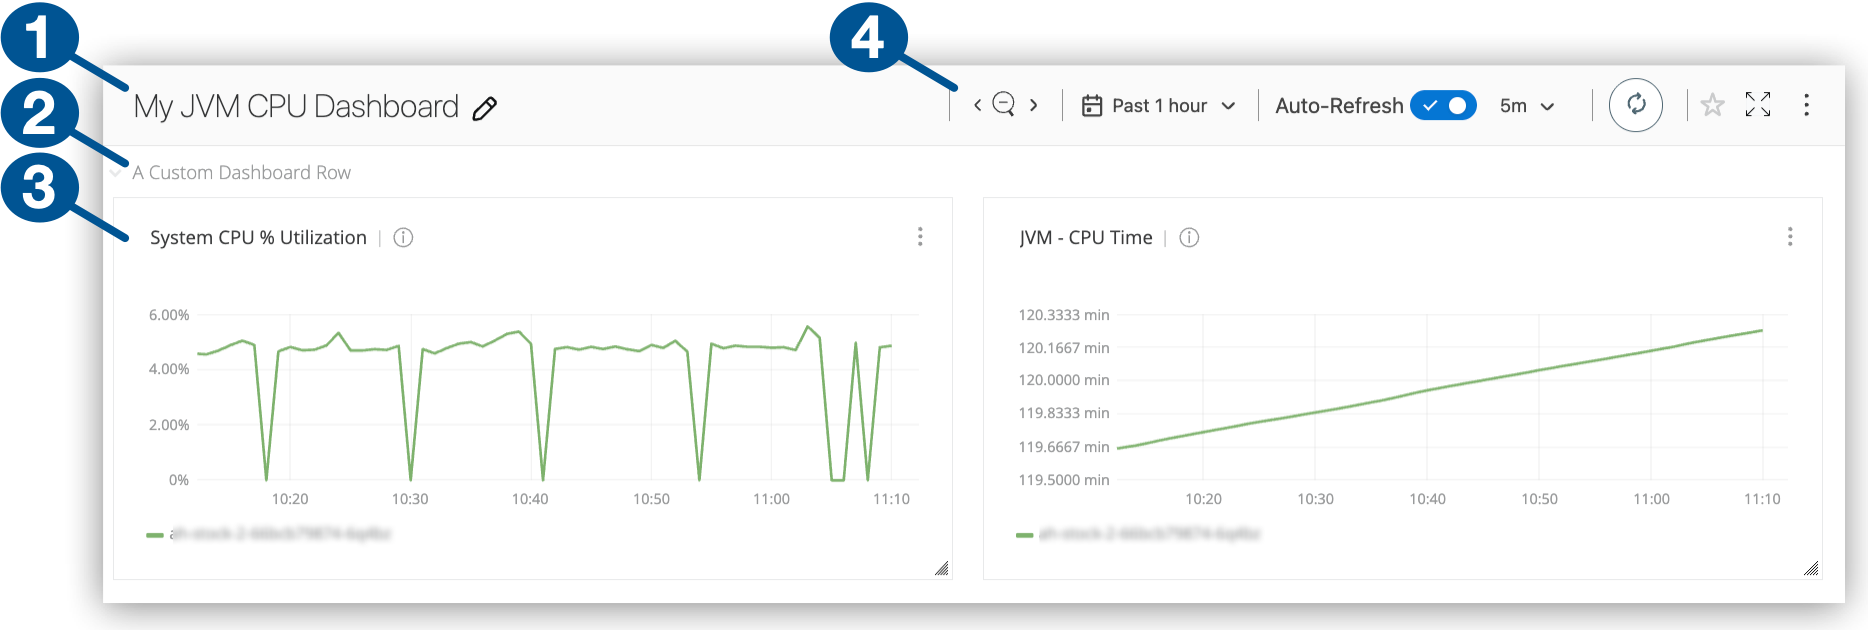
1 Configurable name of the custom dashboard 2 Configurable title of a row in custom dashboard You can add multiple rows to a custom dashboard. Rows can contain multiple charts (also called panels or widgets).
3 Graphs in a custom dashboard row You can create graphs, singlestat charts, tables, and text panels for your custom dashboard. For more information, see Add Charts to a Custom Dashboard.
4 Lookback window, refresh options, and other dashboard settings: -
Zoom in or out.
-
Set a time or date range for the lookback period.
-
Set an autorefresh period, or manually refresh at any time.
-
Favorite your dashboard.
-
View in full screen mode.
-
Duplicate or delete your dashboard.
-
Set Up a Custom Dashboard
Create and configure a custom dashboard in Anypoint Monitoring.
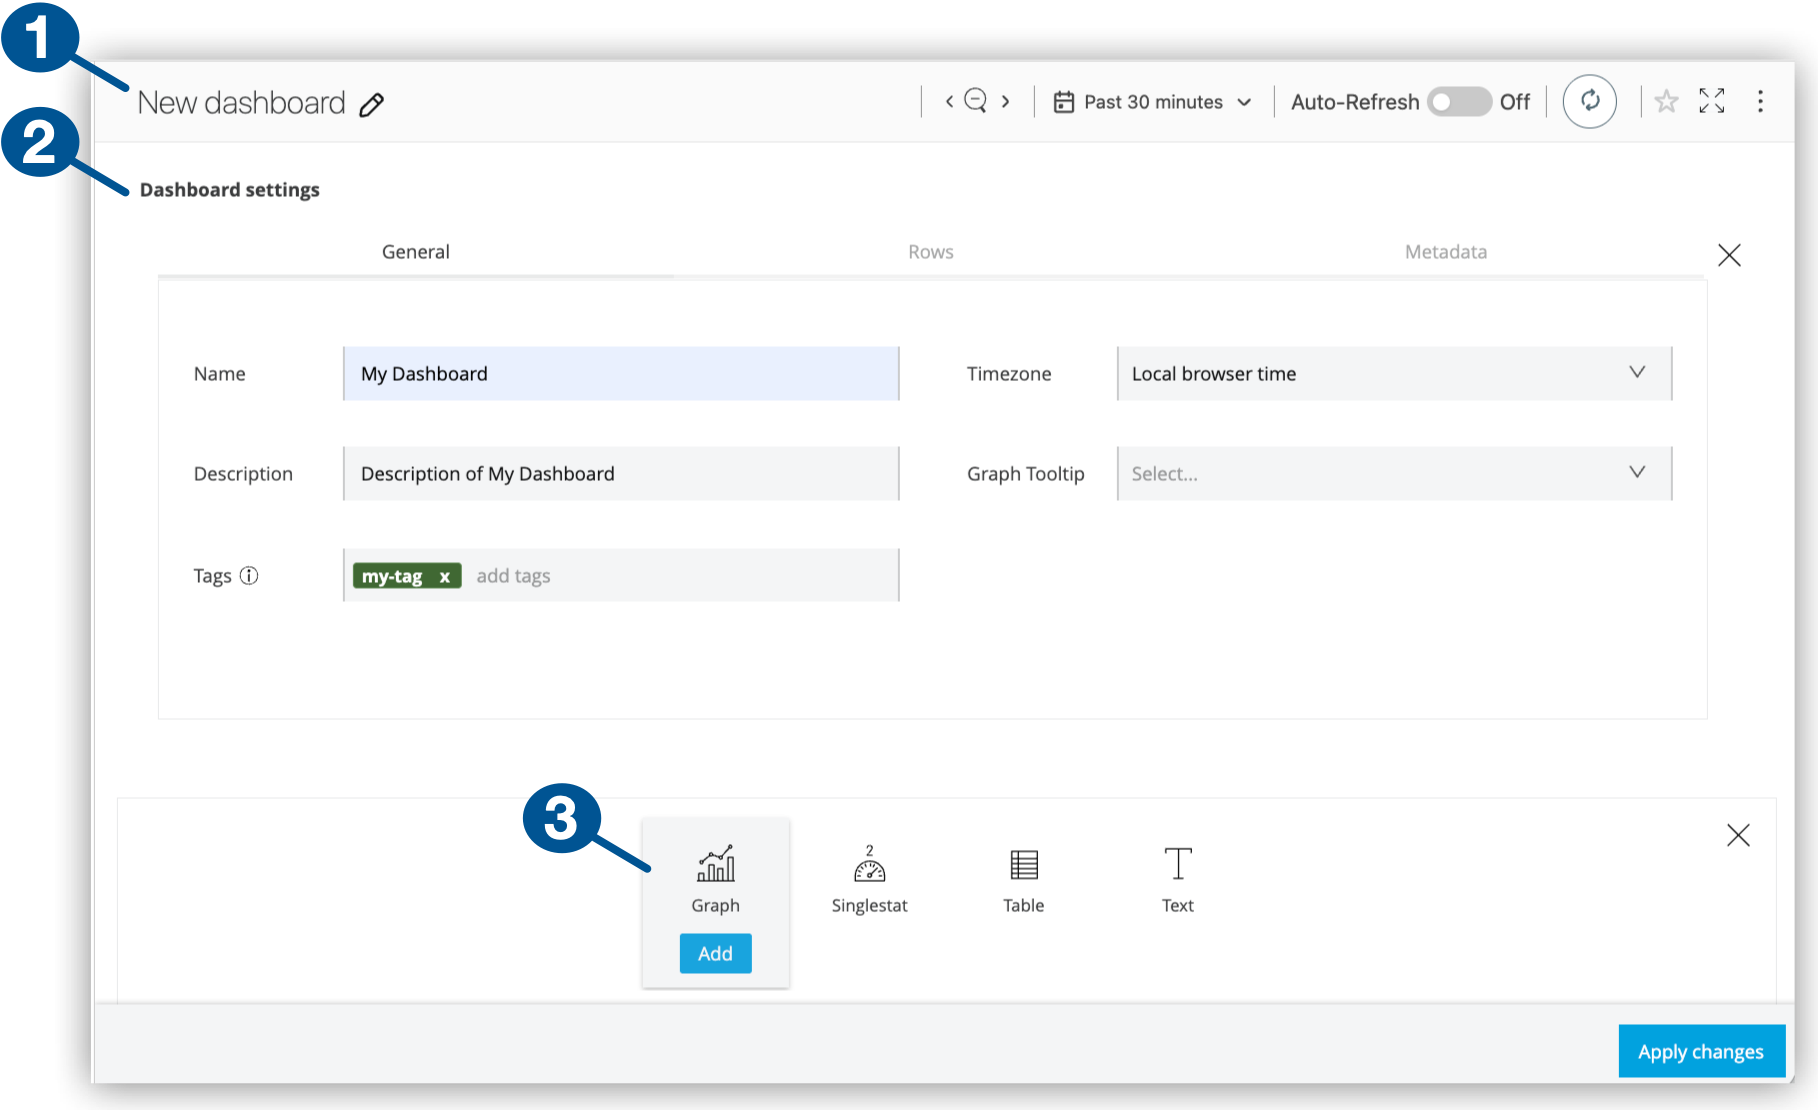
| 1 | Clicking  (pencil) opens the dashboard configuration window. (pencil) opens the dashboard configuration window. |
| 2 | Dashboard settings tabs:
|
| 3 | Charts (also called panels or widgets) you can add to your custom dashboard:
|
Set up a new dashboard:
-
Navigate to Anypoint Monitoring:
Click Monitoring from the Anypoint Platform home page or from the Runtimes menu in the header.
-
In the sidebar, click Custom Dashboards to display custom dashboards.
-
Click New Dashboard.
-
Click
to open the dashboard configuration window. -
Provide a name and other general dashboard settings.
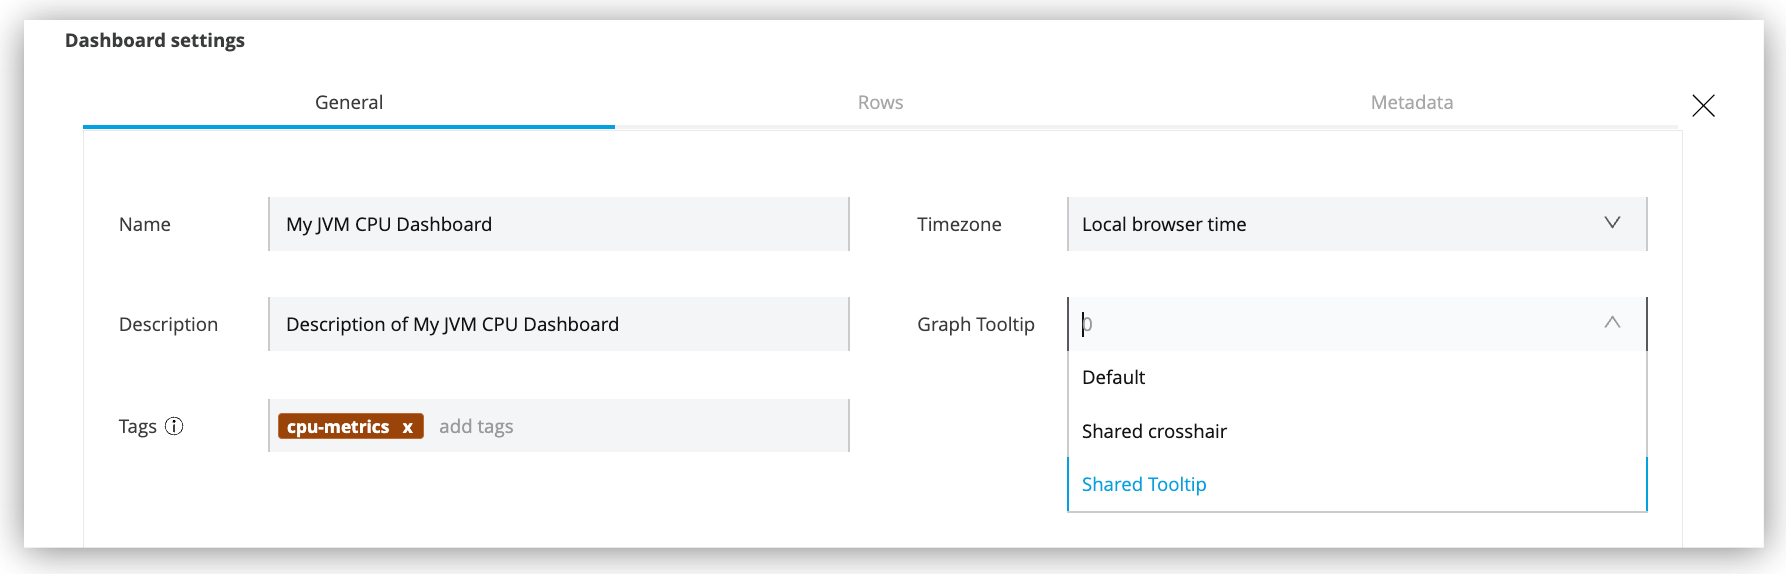
General Dashboard Settings Name
Name for your dashboard.
Description
Description of your dashboard.
Tags
A short identifier that can help you locate a dashboard in the custom dashboard list.
Timezone
Most graphs track data over time, so your time options are important. Your options are:
-
Local browser time: (Default) Time taken from the system time of the computer that the browser is running on.
-
UTC: Coordinated Universal Time standard, which uses a 24 hour cycle (for example,
19:20) and corresponds to GMT.
Graph Tooltip
Options include:
-
Default: The crosshair cursor appears only in the chart that you hover over.
-
Shared Crosshair: The crosshair appears on all charts.
-
Shared Tooltip: The crosshair and the tooltip appear on all charts.
-
-
Add graphs, singlestat charts, tables, or text panels to a row in your custom dashboard.
For guidance, see Add Charts to a Custom Dashboard.
-
Optionally, click Rows to manage the row that contains your chart.
You can provide a title for a row and make the title visible in the dashboard. You can also create additional rows for your charts. See Manage Custom Dashboard Rows.
Add Charts to a Custom Dashboard
Charts are panels (or widgets) you can add to rows in custom dashboards to display metrics on your Mule apps or APIs.
Add a chart to your dashboard:
-
From Custom Dashboards, open your custom dashboard.
For guidance, see View a Custom Dashboard.
-
If you need a new row for your chart, scroll down to find and click Add Row.
For row configuration options, see Manage Custom Dashboard Rows.
-
To add a chart to the row, click Add.

If chart icons aren’t visible in your row:
-
Hover over the row to display its
 (More menu) for the row, and click + Add widget.
This menu appears at the top of the row.
-
Click one of the chart types for your row.
-
-
Hover over the chart to display its
(More menu), and click Configure. -
To configure the chart in a custom dashboard, see:
Manage Custom Dashboard Rows
Manage dashboard rows from the dashboard configuration window.
-
From Custom Dashboards, open your custom dashboard.
For guidance, see View a Custom Dashboard.
-
Click
to open the dashboard configuration window. -
In Dashboard Settings, click Rows to configure your dashboard rows.
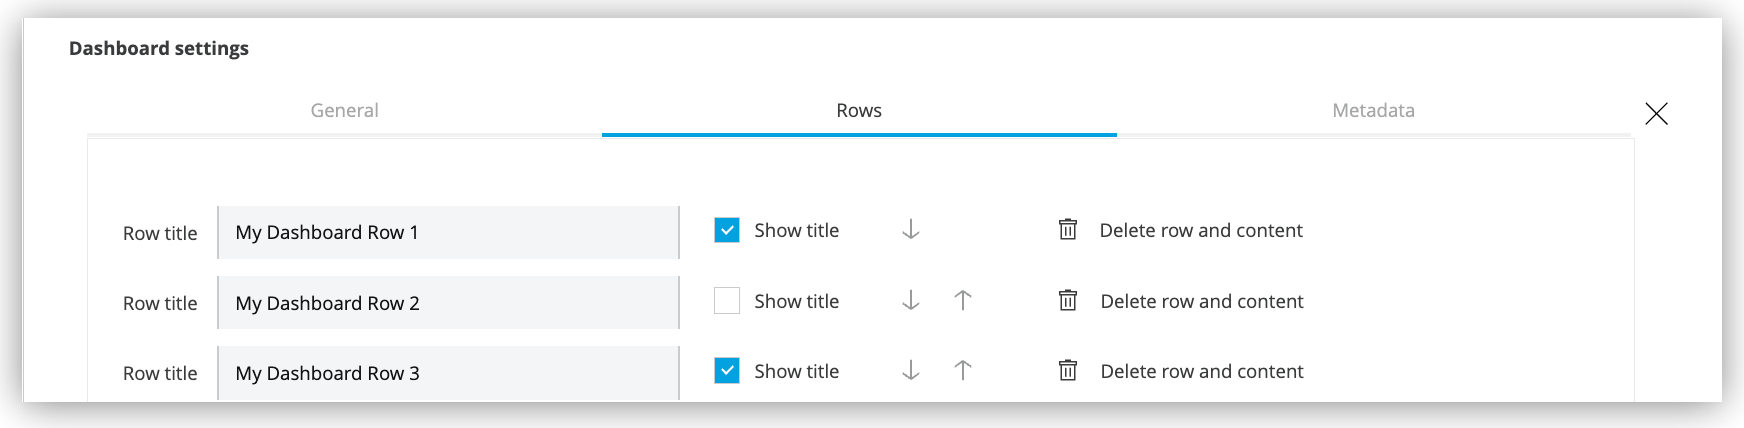
Row Configuration Options for Custom Dashboards Title
Title for your row.
Show Title
Make the title visible to end users.
Up Arrow icon
Move a row up in the dashboard when there is more than one row in the dashboard.
Down Arrow icon
Move a row down when there is more than one row in the dashboard.
Trashcan icon
Delete the row and any charts it contains from the dashboard.
Get Custom Dashboard Metadata
Get information about creation dates, updates, and the custom dashboard version.
-
From Custom Dashboards, open your custom dashboard.
For guidance, see View a Custom Dashboard.
-
Click
to open the dashboard configuration window. -
In Dashboard Settings, click Metadata to review your dashboard information.
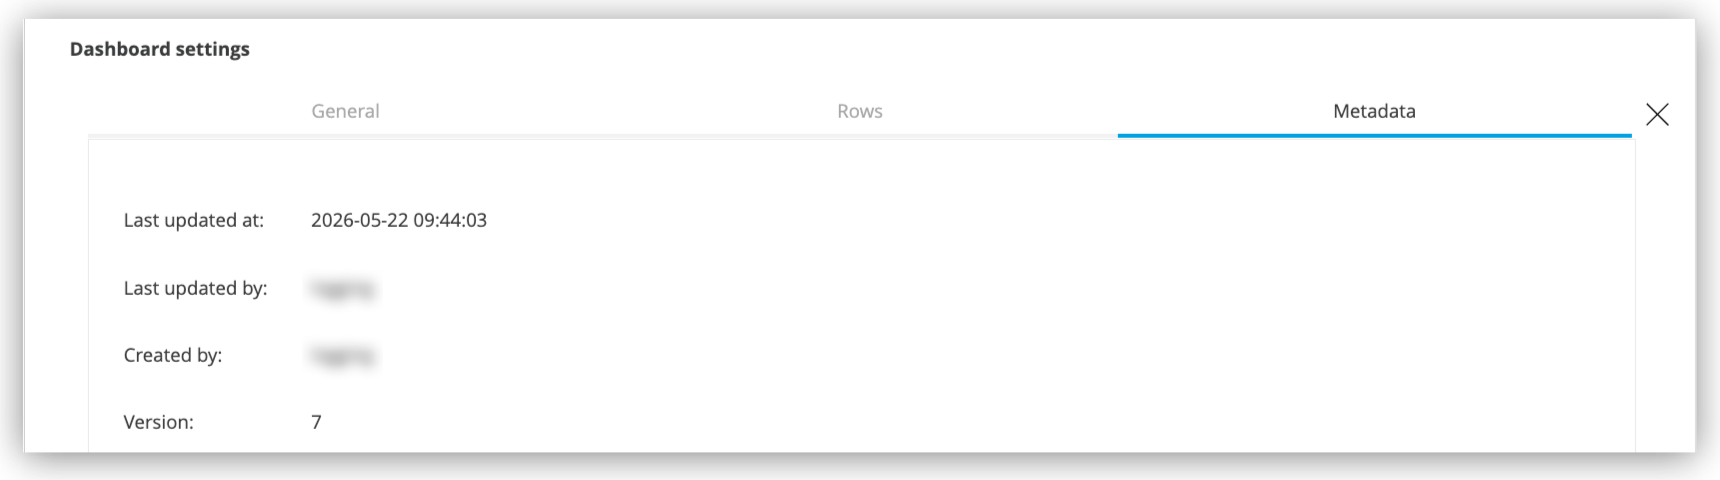
Metadata Available for Custom Dashboards Last Updated at
Date and time of last update to the dashboard.
Last Updated by
User who made the last update.
Created at
Date and time the dashboard was created.
Created by
Username of person who created the dashboard.
Version
Version number of the dashboard. The version increments each time you save modifications to the dashboard.
Duplicate a Custom Dashboard
Create a copy of a dashboard. The copy requires a unique name but retains the configuration and all charts. You can modify that configuration as needed.
-
From Custom Dashboards, open a custom dashboard.
For guidance, see View a Custom Dashboard.
-
From the dashboard’s header, click
(More menu), and select Duplicate. -
Save a New Name for the dashboard.
Your copy of the dashboard opens.
Delete a Custom Dashboard
Delete a custom dashboard you no longer need.
-
From Custom Dashboards, open a custom dashboard.
For guidance, see View a Custom Dashboard.
-
From the dashboard’s header, click
(More menu), and select Delete. -
Confirm the deletion.
Manage Custom Dashboard Charts
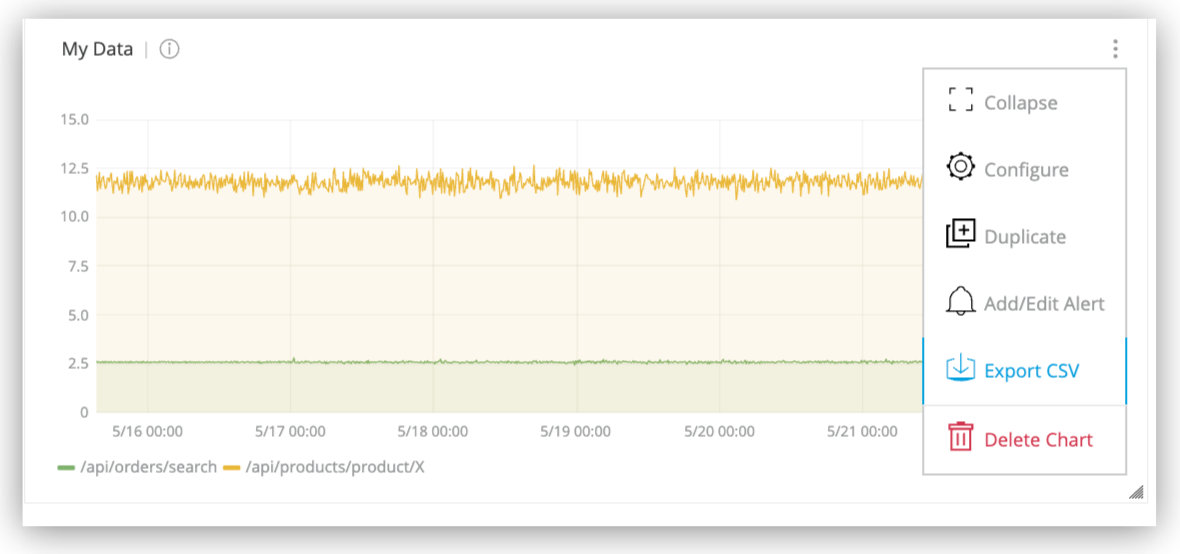
Manage a chart from its (More menu).
-
Collapse or expand the chart.
-
Configure the chart:
-
Duplicate the chart.
-
Add or edit a graph’s alert. Other chart types don’t support alerts.
-
Export graph or table data to a CSV file. Other chart types don’t support CSV exports.
For more information, see Exporting App Data to a CSV File.
-
Delete the chart.