
Generating Real-Time Logs

Generate logs for apps and APIs in real-time and without writing code using Log Points in Anypoint Monitoring. For apps, specify the level of logs to generate, and for APIs, specify properties for the logs. This allows you to extract logs on-demand from applications in real-time, without causing redeployment or app downtime. Manage access with permissions control. All logs flow in to log management.
Log Points for Apps
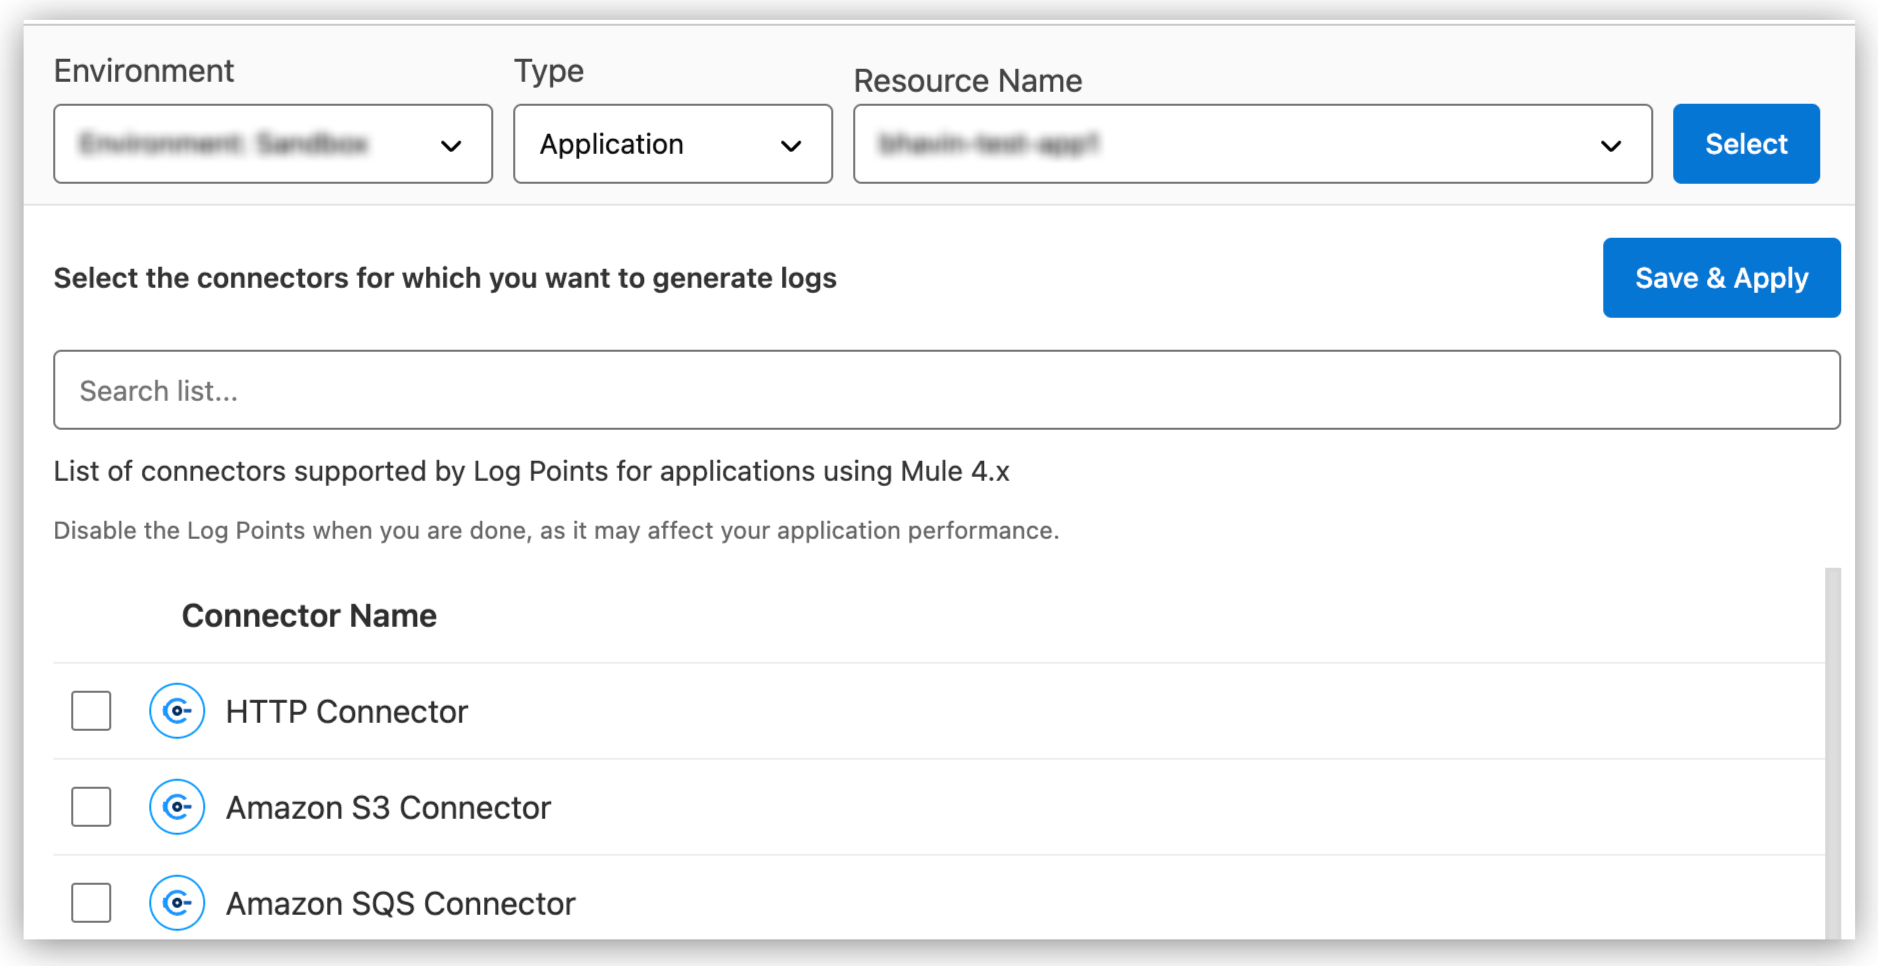
The Application Log Points feature enables you to log information from connectors in any Mule app in real-time. If you are using one of the supported connectors, you can select a log level (debug, info, warn, or error) and generate logs.
Before You Begin
These prerequisites are required:
-
The Anypoint Integration Advanced package or a Titanium subscription to Anypoint Platform
-
The Runtime Manager > Manage Settings permission
Supported Connectors
These Anypoint Connectors are available to Log Points:
-
Amazon S3
-
Amazon SQS
-
Anypoint MQ
-
Database
-
Email
-
File
-
FTP
-
HTTP
-
IBM MQ
-
JMS
-
Microsoft Service Bus
-
MongoDB (Mongo)
-
Object Store
-
Salesforce
-
SFTP
-
Sockets
-
VM
Enable Application Log Points
-
Log in to Anypoint Platform with a user account that has permission to access Anypoint Monitoring content.
-
Navigate to Anypoint Monitoring:
Click Monitoring from the Anypoint Platform home page or from the Runtimes menu in the header.
-
In the sidebar, click Log Points.
-
Select the following:
-
Environment: The environment in which the app is running.
-
Resource name: The name of the app.
-
-
Click Select.
-
Select the connectors for which you want to generate logs.
-
Select a log level for each connector.
-
Click Save & Apply.
A message that your configuration has been applied appears at the top of the page with a View API Logs link. The logs might take a moment to appear. -
Click the View Logs link to view the logs for the selected log point.
| If you select either the trace or debug log level, disable log point monitoring when you are finished, to avoid slowing your application’s performance. |
Log Points for APIs
The Log Points feature for APIs enables you to interactively extract data from running managed APIs. You can specify properties of your managed API (for example, the host and method in the request header) for which to generate logs without having to write code or redeploy your application. This helps you troubleshoot without having to restart the application.
For example, you can specify a cookie header in an API to see if an injection attack is in progress. The log data for the specified cookie header is automatically displayed in real time on the Logs page.
Prerequisites
To use this feature, you must have the following:
-
The Anypoint Integration Advanced package or a Titanium subscription to Anypoint Platform
-
The API Manager > Manage Policies permission
Supported APIs
The following types of API are available for use with the Log Points feature:
-
Basic endpoint APIs (CloudHub and hybrid)
-
CloudHub
-
Hybrid
-
-
Endpoint with Proxy APIs
-
CloudHub proxy
-
Hybrid proxy
-
| All basic endpoint APIs are displayed in the selectors regardless of whether the registered API has a supported Mule runtime engine version. If you save a log point for a basic endpoint API with an unsupported version, the application policy fails. |
Supported Versions of Mule Runtime Engine
Run your Mule app on a supported Mule runtime version. For supported versions, see Mule Runtime Release Notes.
Enable API Log Points
-
Log in to Anypoint Platform with a user account that has permission to access Anypoint Monitoring content.
-
Navigate to Anypoint Monitoring:
Click Monitoring from the Anypoint Platform home page or from the Runtimes menu in the header.
-
In the sidebar, click Log Points.
-
Select the following:
-
Environment: The environment the API is running in.
-
Resource name: The name of the API.
-
Version/Instance: The version and instance of the API.
-
-
Click Select.
-
Select the Request points to log and monitor.
You can monitor the following request header log points:-
User Agent
-
Path
-
Host
-
Method
-
Remote Access
-
Accept
-
Accept Encoding
-
Accept Language
-
Cookie
-
Referrer
You can click the blue box to the left of Header, to select all log points.
Select Body to monitor the Request Body.
-
-
Select the Response points to log and monitor.
You can monitor the following request header log points:-
Status Code
-
Connection
-
Date
-
Set-Cookie
-
Pragma
You can click the blue box to the left of Header to select all log points. Select Body to monitor the Response Body.
-
-
Click Save & Apply.
A message that your configuration has been applied appears at the top of the page with a View API Logs link. The logs might take a moment to appear. -
Click the View API Logs link to view the logs for the selected log point.
| When you are finished monitoring API log points, disable log point monitoring to avoid slowing your application’s performance. |