Viewing Reports in Anypoint Monitoring
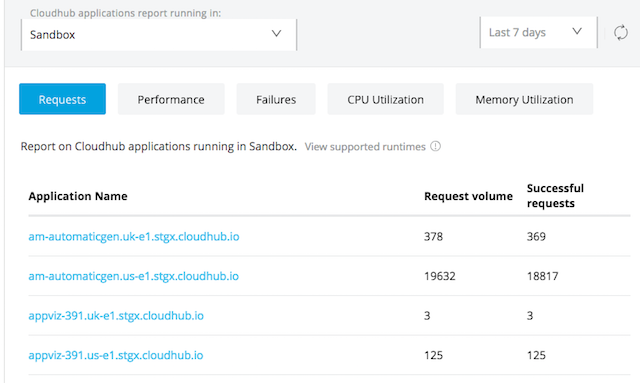
Reports allow you to view a list of apps running in an environment. The reports display information about overall performance and behavior across all the apps in the environment. These reports can help you identify app performance and availability problems across the environment so you can better maintain the expected level of service for your apps.

From any of the Reports tabs, you can:
-
View these reports:
-
All deployment types provide Requests reports, Performance reports, and Failures reports.
-
CloudHub deployments provide CPU Utilization reports and Memory Utilization reports.
-
-
Switch environments.
-
Select a time range for which to view the reports.
-
Click an app in the list to go to its built-in dashboard.
-
Click on column headings to sort the lists from highest to lowest, or from lowest to highest numbers.
-
Refresh the page.
-
Export a report as a CSV file.
Access Reports
-
Log in to Anypoint Platform with a user account that has permission to access Anypoint Monitoring content.
-
Navigate to Anypoint Monitoring:
Click Monitoring from the Anypoint Platform home page or from the Runtimes menu in the header.
-
In the sidebar, click Reports.
-
In the Environment drop-down list, select the environment where the apps you want to view reports for are deployed, and click View.
The first time you view the reports page, the Requests report is displayed. -
Select a time range from the drop-down list to view reports for a specific time range.

To view other reports, click the corresponding tab for the report to view. From any report tab, you can click the app name to view statistics for that app on its corresponding builtin dashboard.
| For applications that run using a stand-alone runtime or hybrid environments, data is shown only for Requests, Performance, and Failures tabs. CPU and memory utilization data are not shown for hybrid applications. |
Requests
Click the Requests tab to view information about app requests, including:
-
Request Volume: The total number of inbound requests to the app within the specified time range.
-
Successful Requests: The total number of successful inbound requests to the app within the specified time range.
Performance
Click the Performance tab to view information about app performance metrics, including:
-
Request Volume: The total number of inbound requests to the app in the specified time range.
-
Response Time: The average response time (in milliseconds) for inbound requests to the app.
Failures
Click the Failures tab to view information about app request failures, including:
-
Request Volume: The total number of inbound requests to the app within the specified time range.
-
Failed Requests: The total number of failed inbound requests to the app for the specified time range. An inbound request failure occurs when a Mule flow in your deployed Mule app throws an exception. Inbound failures differ from outbound failures, which indicate exceptions from outbound connector operations, such as from an HTTP Request operation in the Anypoint Connector for HTTP (HTTP Connector). Failure counts apply only to exceptions from the app, so a 4xx or 5xx reply code to a caller isn’t a failure unless the reply is due to an unmanaged exception.
-
Successful Requests: The number of successful inbound requests to the app in the specified time range.
CPU Utilization
Click the CPU Utilization tab to view information about the average percentage of the CPU utilized by the JVM.
Memory Utilization
Click the Memory Utilization tab to view information about the memory utilization of each app running in the environment, including:
-
Memory Utilization: The amount of the heap memory used by the JVM.
-
Total Memory: The total size of the app’s heap memory.
-
Memory Pressure: The percentage of the heap memory used (the difference between memory used and memory total).
Export a Report as a CSV
You can export a report as a CSV file and save it locally for any of the tabs in the Reports page.
-
In the sidebar, click Reports.
-
Click on the tab for the report to export.
-
(Optional) Apply a time filter to download reports for the specified time period.
-
In the upper right corner of the page, click Export CSV.
The CSV file is automatically downloaded in your browser.


