
Analyze Business and API Data Using ELK
Use the Elastic Stack (ELK stack) to analyze the business data and API analytics generated by Anypoint Platform Private Cloud Edition (Anypoint Platform PCE). You can use Filebeat to process Anypoint Platform log files, insert them into an Elasticsearch database, and then analyze them with Kibana.
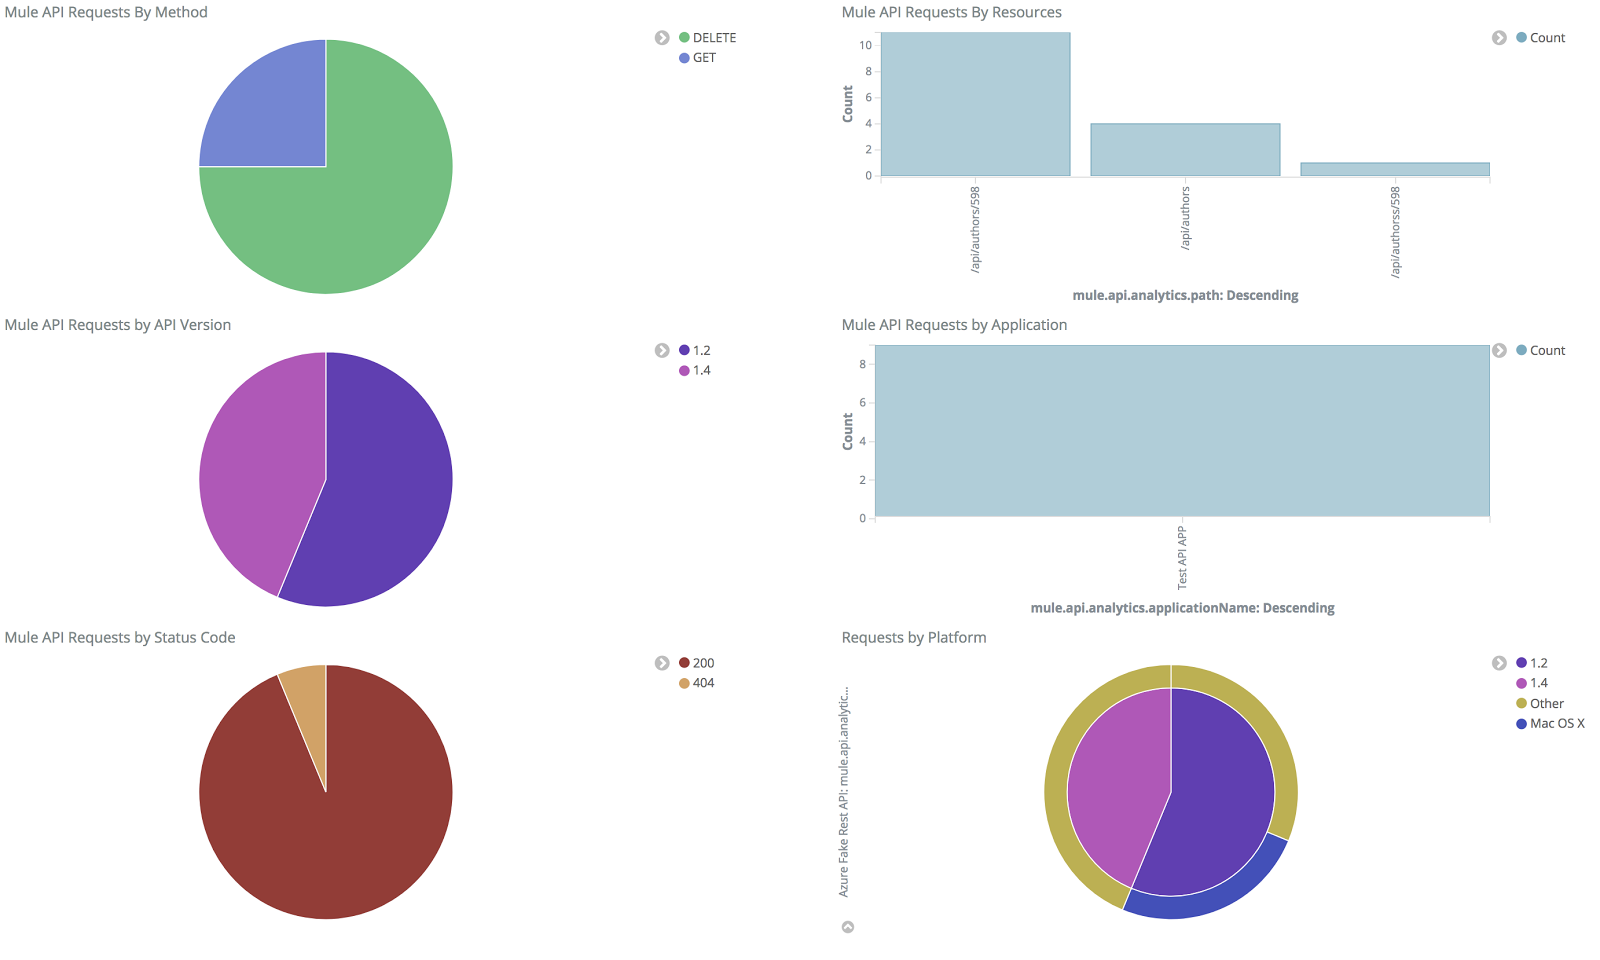
The following example shows how API data appears in Kibana:
Prerequisites
-
Required software
To export external analytics data to ELK, you must have the following software:
-
Mule runtime engine (Mule), version 3.8.4 or later
-
Anypoint Runtime Manager agent, version 1.7.0 or later
-
Elasticsearch, version 7.6.2
-
Filebeat, version 7.6.2
-
Kibana, version 7.6.2
-
-
Ensure that you have installed and configured your Mule runtime engine instances.
-
Ensure that you have registered your Mule runtime engine instances with Runtime Manager.
Edit the wrapper.conf Properties File
In your Mule runtime installation, edit the following properties in the conf/wrapper.conf file:
-
Set the
analytics_enabledproperty totrue:wrapper.java.additional.<n>=-Danypoint.platform.analytics_enabled=true
-
Remove the URI value from the
analytics_base_uriproperty:wrapper.java.additional.<n>=-Danypoint.platform.analytics_base_uri=
-
Set the
on_premproperty totrue:wrapper.java.additional.<n>=-Danypoint.platform.on_prem=true
Enable Event Tracking
To export business and event tracking data, you must enable event tracking in Runtime Manager:
-
From Anypoint Platform, select Runtime Manager.
-
Select Servers.
-
Select the row containing the server on which you want to configure ELK.
-
Select Manager Server and then select the Plugins tab.
-
In Event Tracking, select Business Events from the Levels drop-down menu.
-
Select the switch to enable event tracking on ELK.
Runtime Manager displays the ELK Integration dialog.
-
Configure the log files as necessary.
-
Select Apply.
Enable API Analytics
To export API analytics, you must enable API analytics in Runtime Manager.
-
From Anypoint Platform, select Runtime Manager.
-
Select Servers.
-
Select the row containing the server on which you want to configure ELK.
-
Select the switch to enable API analytics and then select the switch next to ELK.
-
Configure the log files as necessary.
-
Select Apply.
Install and Configure the Filebeat Agent
On each server with Mule runtime instances, download and install Filebeat for your operating system.
Configure the Mule Filebeat Module
On each server with Mule runtime instances, download and expand the Filebeat Module archive from the following URL:
https://s3.us-east-2.amazonaws.com/elk-integration/elk-integration-06-08-20/elk-integration.tar.gz
-
Add the absolute paths of each log file to the
manifest.ymlfiles:-
Inside the
businesseventsfolder, set the event log paths to thevarvariable of your operating system (OS):var: - name: paths default: - /var/mule/logs/events.log os.darwin: - /var/mule/logs/events.log os.windows: - /var/mule/logs/events.log -
Inside the
apianalyticsfolder, set the API analytics log paths to thevarvariable of your OS:var: - name: paths default: - /var/mule/logs/api-analytics-elk.log* os.darwin: - /var/mule/logs/api-analytics-elk.log* os.windows: - c:/programdata/mule/logs/api-analytics-elk.log*
-
-
Copy the
mulemodule folder to themodulefolder of your Filebeat installation. -
Copy the
mule.ymlfile to themodules.dfolder of your Filebeat installation. -
Start Elasticsearch and then Kibana.
-
Set up Filebeat and provision dashboards to Kibana.
Inside your Filebeat installation folder, execute the following command. Replace the
${filebeat-installation-folder}with the path to your Filebeat installation root folder, and change the Elasticsearch host if needed.
/filebeat setup -e \-E output.elasticsearch.hosts="['localhost:9200']" \ -E output.elasticsearch.index="mule-%{+yyyy.MM.dd}" \ -E setup.dashboards.enabled=true \ -E setup.dashboards.directory=${filebeat-installation-folder}/module/mule/_meta/kibana \ -E setup.ilm.enabled=false \ -E setup.template.name="mule" \ -E setup.template.pattern="mule-*" \ -E setup.template.overwrite=true --- -
Start Filebeat.
Inside your Filebeat installation folder, execute the following command. Replace the
${filebeat-installation-folder}with the path to your Filebeat installation root folder, and change the Elasticsearch host if needed../filebeat -e \ -E output.elasticsearch.hosts="['localhost:9200']" \ -E output.elasticsearch.index="mule-%{+yyyy.MM.dd}" \ -E setup.dashboards.enabled=true \ -E setup.dashboards.directory=${filebeat-installation-folder}/module/mule/_meta/kibana \ -E setup.ilm.enabled=false \ -E setup.template.name="mule" \ -E setup.template.pattern="mule-*" \ -E setup.template.overwrite=true
Configure Kibana to Load an Index
After installing Filebeat and Elasticsearch, you must configure Kibana to consume data from Anypoint Platform.
MuleSoft provides a default Kibana configuration that you can use to analyze business and API data. This configuration includes dashboards, searches, and visualizations.
-
Configure an index pattern
You must create an Elasticsearch index for Anypoint Platform data:
-
Generate an initial set of data.
This is required for Kibana to be able to recognize the index to be created. To send a request to a test API to generate an initial set of data:
-
In the Kibana management console, create an index pattern with
mule-*as the value. -
Select @timestamp in Time Filter field name.
-
In Show advanced options, set mule-index as the value in the Custom index pattern ID field.
-
-
Create the index.
You can now access all the Mule dashboards in the Dashboard tab.
-