
Ops Center
The Ops Center is a web-based management tool that enables you to manage and monitor Anypoint Platform Private Cloud Edition (Anypoint Platform PCE) and perform the following types of tasks:
-
Add and remove servers
-
View logs and configure log forwarding
-
Monitor system stability and performance
Access the Ops Center
-
Go to the following URL:
https://{platform-host}:9500 -
Enter the admin user email address and password that you created during installation.
Add Additional Servers
Adding servers enables you to scale up your cluster, even after the installation is complete.
-
Log in to Ops Center.
-
Select Servers and then select Add Existing.
-
Select the type of node you want to add.
The nodes available depend on the number of nodes in your installation.
-
Select Continue.
Ops Center displays a command similar to the following:
curl -s --tlsv1.2 --insecure "https://172.31.48.9:3009/t/8402020736a8a04dda29bc81dfcd5211/node" | sudo bash
-
Run the command that is displayed on the machine where you are installing the new server.
-
You must run this command from an account that has root access.
-
You can only perform this installation on one server at a time.
After performing this command, the server is displayed in a list in Ops Center.
-
-
If necessary, specify the IP address and devices.
-
Select the server and then select Start Installation to begin installation of the new server.
Remove a Server
You can remove individual servers from the cluster where the platform is installed.
| Deleting a server also removes any applications that are deployed on the server. |
-
Log in to Ops Center.
-
Select Servers.
-
Select the IP address of the server you want to delete and then select Delete.
-
Confirm that you want to delete the server.
Configure Log Forwarding
Anypoint Platform PCE enables you to forward server-level log data. Log forwarding is designed to forward your logs to a local third-party log solution. Forwarding log data to a cloud-based service like Splunk Cloud is not supported.
|
This information is specific to forwarding log data from Anypoint Platform itself. For instructions on how to forward log data from the Mule servers and applications that run on Anypoint Platform, see Sending Data from Runtime Manager to External Analytics Software. |
Anypoint Platform uses rsyslog to handle logging. To forward logs to remote hosts, perform the following steps:
-
Log in to Ops Center.
-
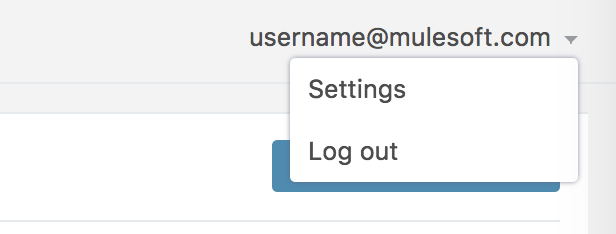
In the upper right-hand corner, select the admin user name.
-
Select Settings and then select Logs.
-
Select Create or New Connector if you already have a log forwarder configured.
-
Configure your log forwarding as shown in the following example:
kind: logforwarder
version: v2
metadata:
   name: forwarder1
spec:
   address: 192.168.100.1:514
   protocol: udp
Monitor Stability and Performance
Ops Center enables you to view data about the stability and performance of the platform.
Metrics dashboards are available for the following application components:
-
Anypoint Services
-
Cluster
-
Object Store
-
Pods
-
PostgreSQL
-
Redis
High-resolution metrics are stored for a default period of 30 days. Other metrics are retained from a period of 6 months up to 5 years.
View Metrics
-
Log in to Ops Center.
-
Select the Monitoring tab.
By default, Ops Center displays the Cluster dashboard.
When viewing dashboards, navigate by selecting from a series of drop-down menus. The options that are available depend on the selected dashboard. For example, in the Pods dashboard, you can select a namespace and a podname.
Change the Time Scale Displayed in the Charts
To change the time scale displayed in the charts:
-
Select the currently selected time scale.
-
Select an option or provide start and end dates.
Anypoint Services Dashboard
The Anypoint Services dashboard displays metrics for the different platform sub-components, including Anypoint Exchange, API notebooks, or the Home page. You can filter data by a specific microservice.
This dashboard displays the following metrics:
-
Processor
-
Memory
-
Network
-
Filesystem
Each of these metrics is displayed by service.
Cluster Information Dashboard
The Cluster Information dashboard displays the following metrics for the various nodes that make up your platform cluster. You can filter data by nodename.
-
Overall CPU Usage
-
CPU Usage by Node
-
Individual CPU Usage
-
Memory Usage by Node
-
Individual Memory Usage
-
Overall Cluster Network Usage
-
Network Usage by Node
-
Individual Node Network Usage
-
Overall Cluster Filesystem Usage
-
Filesystem Usage by Node
-
Individual Node Filesystem Usage
These metrics have different scopes, depending on the context:
-
Overall metrics show an aggregate number for the entire set of nodes.
-
Metrics that are by node display each node as a separate curve on the same chart.
-
Individual node metrics are only displayed for the node that you selected in the nodename drop-down at the top of the section.
Object Store Dashboard
The Object Store dashboard displays data about the different nodes that make up the object store. It includes the following metrics:
-
Node Status
-
Read/Write Requests (in requests per second)
-
Read/Write Latency
-
Active Connections
-
Unavailable Exceptions
-
Disk Space Used
Metrics that deal with Read/Write values display read and write values as separate curves.
Pod Dashboard
The Pod dashboard displays data for the individual Docker containers running different platform services. You can filter data by namespace or podname.
The following metrics are displayed:
-
Individual CPU Usage
-
Individual Memory Usage
-
Individual Network Usage
-
File system Usage
These metrics are displayed for the selected namespace and podname.
PostgreSQL Dashboard
The PostgreSQL dashboard displays data for the PostgreSQL server included in the platform. The following metrics are displayed:
-
Activity per type
-
Cache Hit Ratio
-
Active Connections
-
Buffers
-
Conflicts/Deadlocks
-
PostgreSQL Containers CPU Usage per Pod
Activity per type displays different curves for rows fetched, returned, inserted, updated, and deleted, at the level of time granularity that you choose.
Download Data
To download the data displayed in this section as a JSON:
-
Select the gear icon at the top of the Ops Center.
-
Select Export.
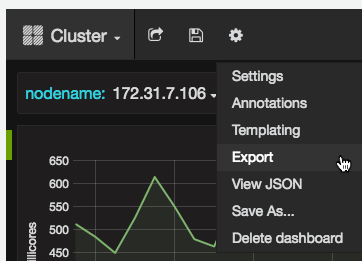
Alternatively, you can select Save as… to download this file with a custom name. You can also select the View JSON option to view this data without downloading it.
Reset Your Password
To change the password required to log into the Ops Center:
-
Enter the gravity utility:
This utility is added during the platform installation.
sudo gravity enter
-
Reset the password using the following command:
gravity site --insecure reset-password
This command returns the administrator email and password, for example:
password for admin@example.com has been reset to: xxxxxxxxx