Setting Up Alerts for Custom Dashboards in Anypoint Monitoring (US and EU)
In the US and EU Clouds, set up alerts for charts in custom dashboards, from the chart’s Alert tab. Alerts trigger email notifications if a data point you’re measuring has passed a specified threshold in the past five minutes. This five-minute period is fixed and not configurable.
For apps configured to run with more than one worker, charts that display worker-related metrics in Anypoint Monitoring dashboards break down the metrics by worker.
When you configure an alert for a graph, an alert state icon appears in the chart.
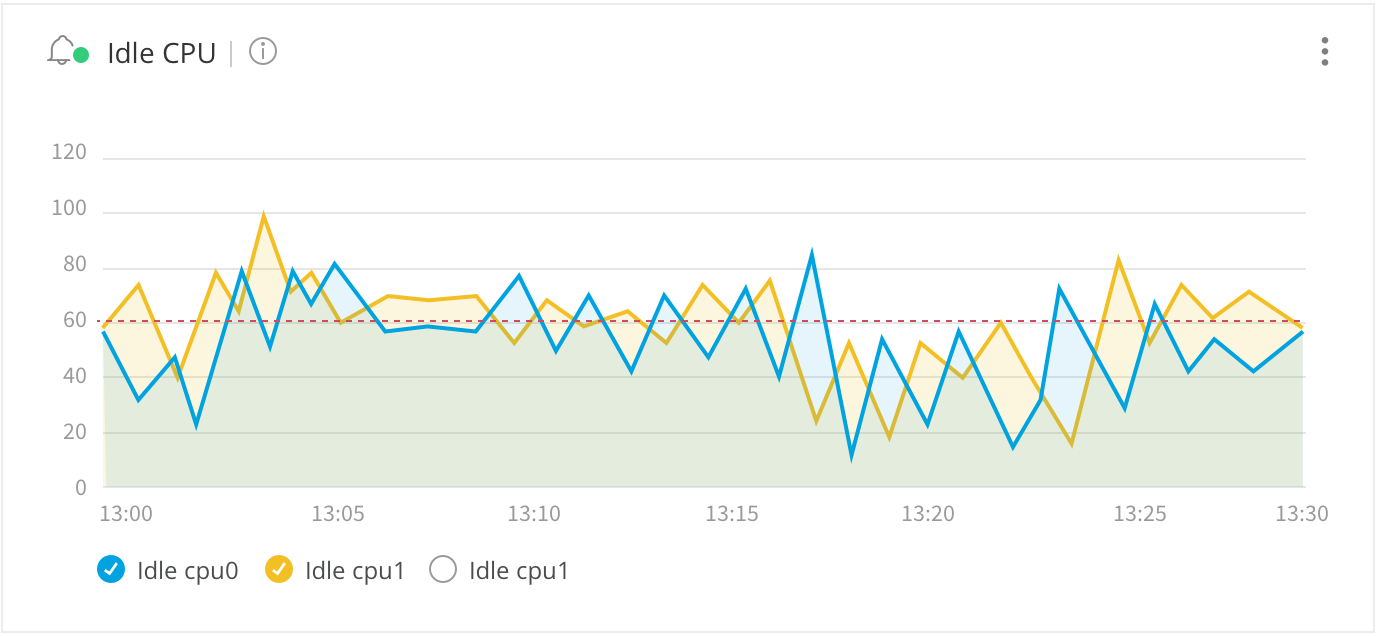
Hover over the bell icon to trigger a description popup. In this case, the description indicates Status OK.
Alert states are defined as follows:
- No data
-
No data is available in the series to evaluate the alert threshold.
- Paused
-
The alert is disabled and no longer active.
- Alerting
-
The value of the metric passes the specified threshold.
- OK
-
The value of the metric has not passed the threshold.
- Pending
-
The alert is enabled and waiting for evaluation.
Create an Alert for a Chart in a Custom Dashboard
-
Navigate to the configuration screen for a graph in a custom dashboard. For guidance, see Configuring Custom Dashboards.
-
Provide a general configuration for the graph that (at minimum) defines the metric, environment, and resource for which you want to set the alert.
For guidance, see General Settings.
-
Navigate to the Alert configuration tab for the graph.
-
Ensure that Advanced Mode is disabled.
Alerts aren’t available for charts with advanced mode configurations.
-
Click Add Alert.
-
Use Alert Config to configure the alert. See Alert Config.
-
Configure email notifications when an alert is triggered. See Notifications.
-
Click Save Changes.
-
Click
Xto exit the configuration and return to the dashboard.
Note that you can also view state history and delete alerts.
Configure an Alert for a Chart in a Custom Dashboard
In the Alert Config section, configure the condition under which an alert is triggered.
| Settings for Alerts in Custom Dashboards | |
|---|---|
Name |
A title for your alert |
Severity level |
The severity level of your alert. |
|
WHEN: For triggering an alert when the metric being measured is above a specified level |
Available severity levels:
- Info
-
May be assigned to alerts that do not require immediate attention when triggered. This severity indicates the metric should be passively monitored.
- Warning
-
May be assigned to alerts that require prompt attention when triggered. This severity indicates an alert should be closely monitored.
- Critical
-
May be assigned to alerts that require immediate attention when triggered. This severity indicates an alert should receive an immediate response.
Send Notifications
Configure an email notification when an alert is triggered.
| Notification Settings for Alerts | |
|---|---|
|
Email address for each recipient of the alert notification. If you add or change the email address of an alert recipient, they don’t receive an email until the alert is triggered. |
|
Message to send to the recipient. |