Creating Alerts for Servers, Server Groups, and Clusters
Configure proactive monitoring alerts for your hybrid standalone infrastructure to ensure optimal performance, detect issues early, and maintain system reliability across your distributed Mule runtime environment.
Overview
Runtime Manager provides comprehensive alerting capabilities for monitoring your hybrid standalone infrastructure, including:
-
Individual server health and performance monitoring
-
Server group coordination and member status tracking
-
Cluster connectivity and node health supervision
-
Resource utilization threshold monitoring (CPU, memory, load average, thread count)
-
Infrastructure lifecycle event notifications (connections, disconnections, deletions)
|
Runtime Manager retains 30 days of alert history for audit and analysis. Alerts retrigger when conditions continuously exceed specified thresholds, ensuring persistent notification of ongoing issues. |
Rate Limits on Alerts
Anypoint Platform enforces rate limits that determine how often an alert is triggered and prevent excessive emails from being sent. At present, there is no defined limit to the number of Runtime Manager alerts.
Create an Alert
Configure alerts to monitor your servers, server groups, and clusters with customizable thresholds and notification settings.
-
In Runtime Manager, click Alerts.
-
If no alerts exist, you see the initial setup page:
 Figure 1. The arrow shows the Create your first alert option.
 -
For existing alert configurations, use the add button:
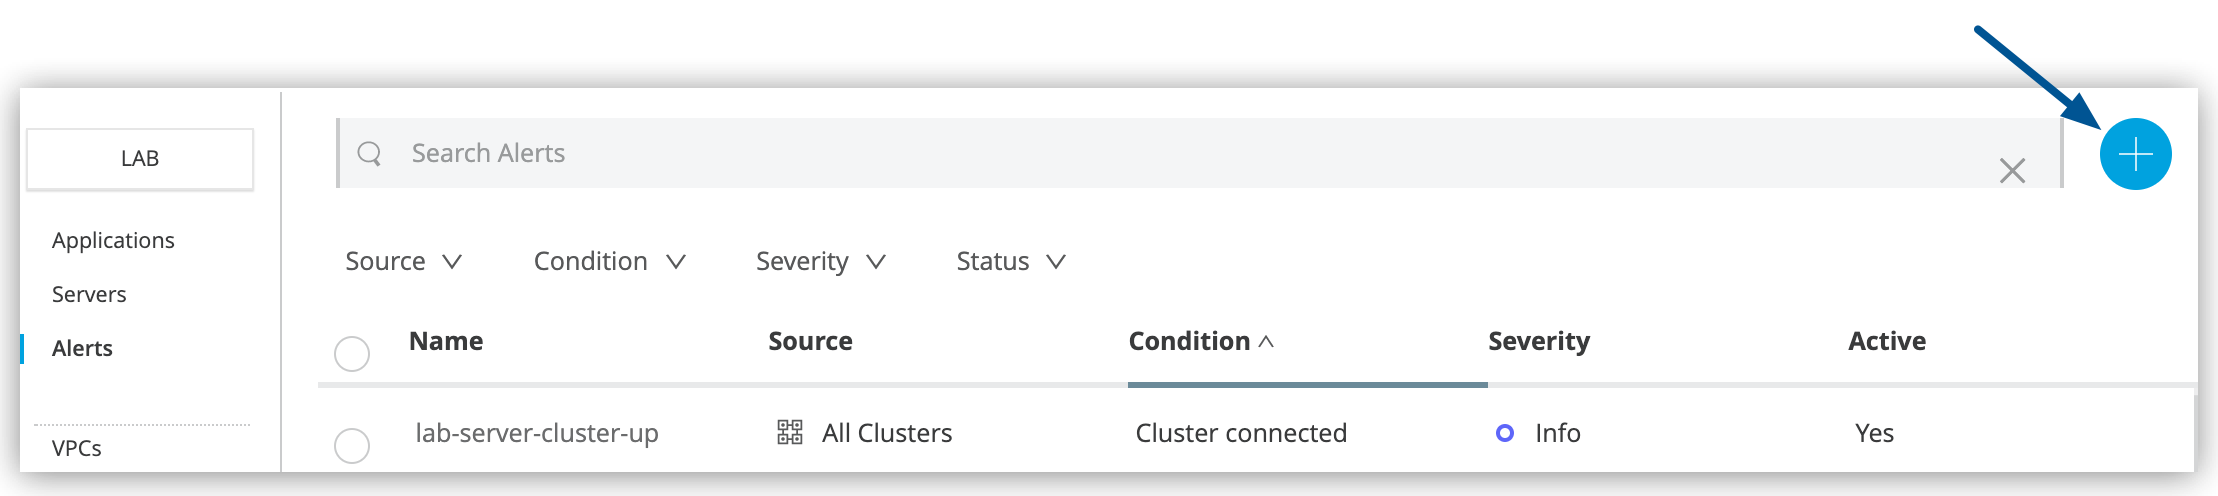 Figure 2. The arrow shows the blue plus (+) icon on the Alerts page.
-
-
Click the blue plus (+) icon to create a new alert.
-
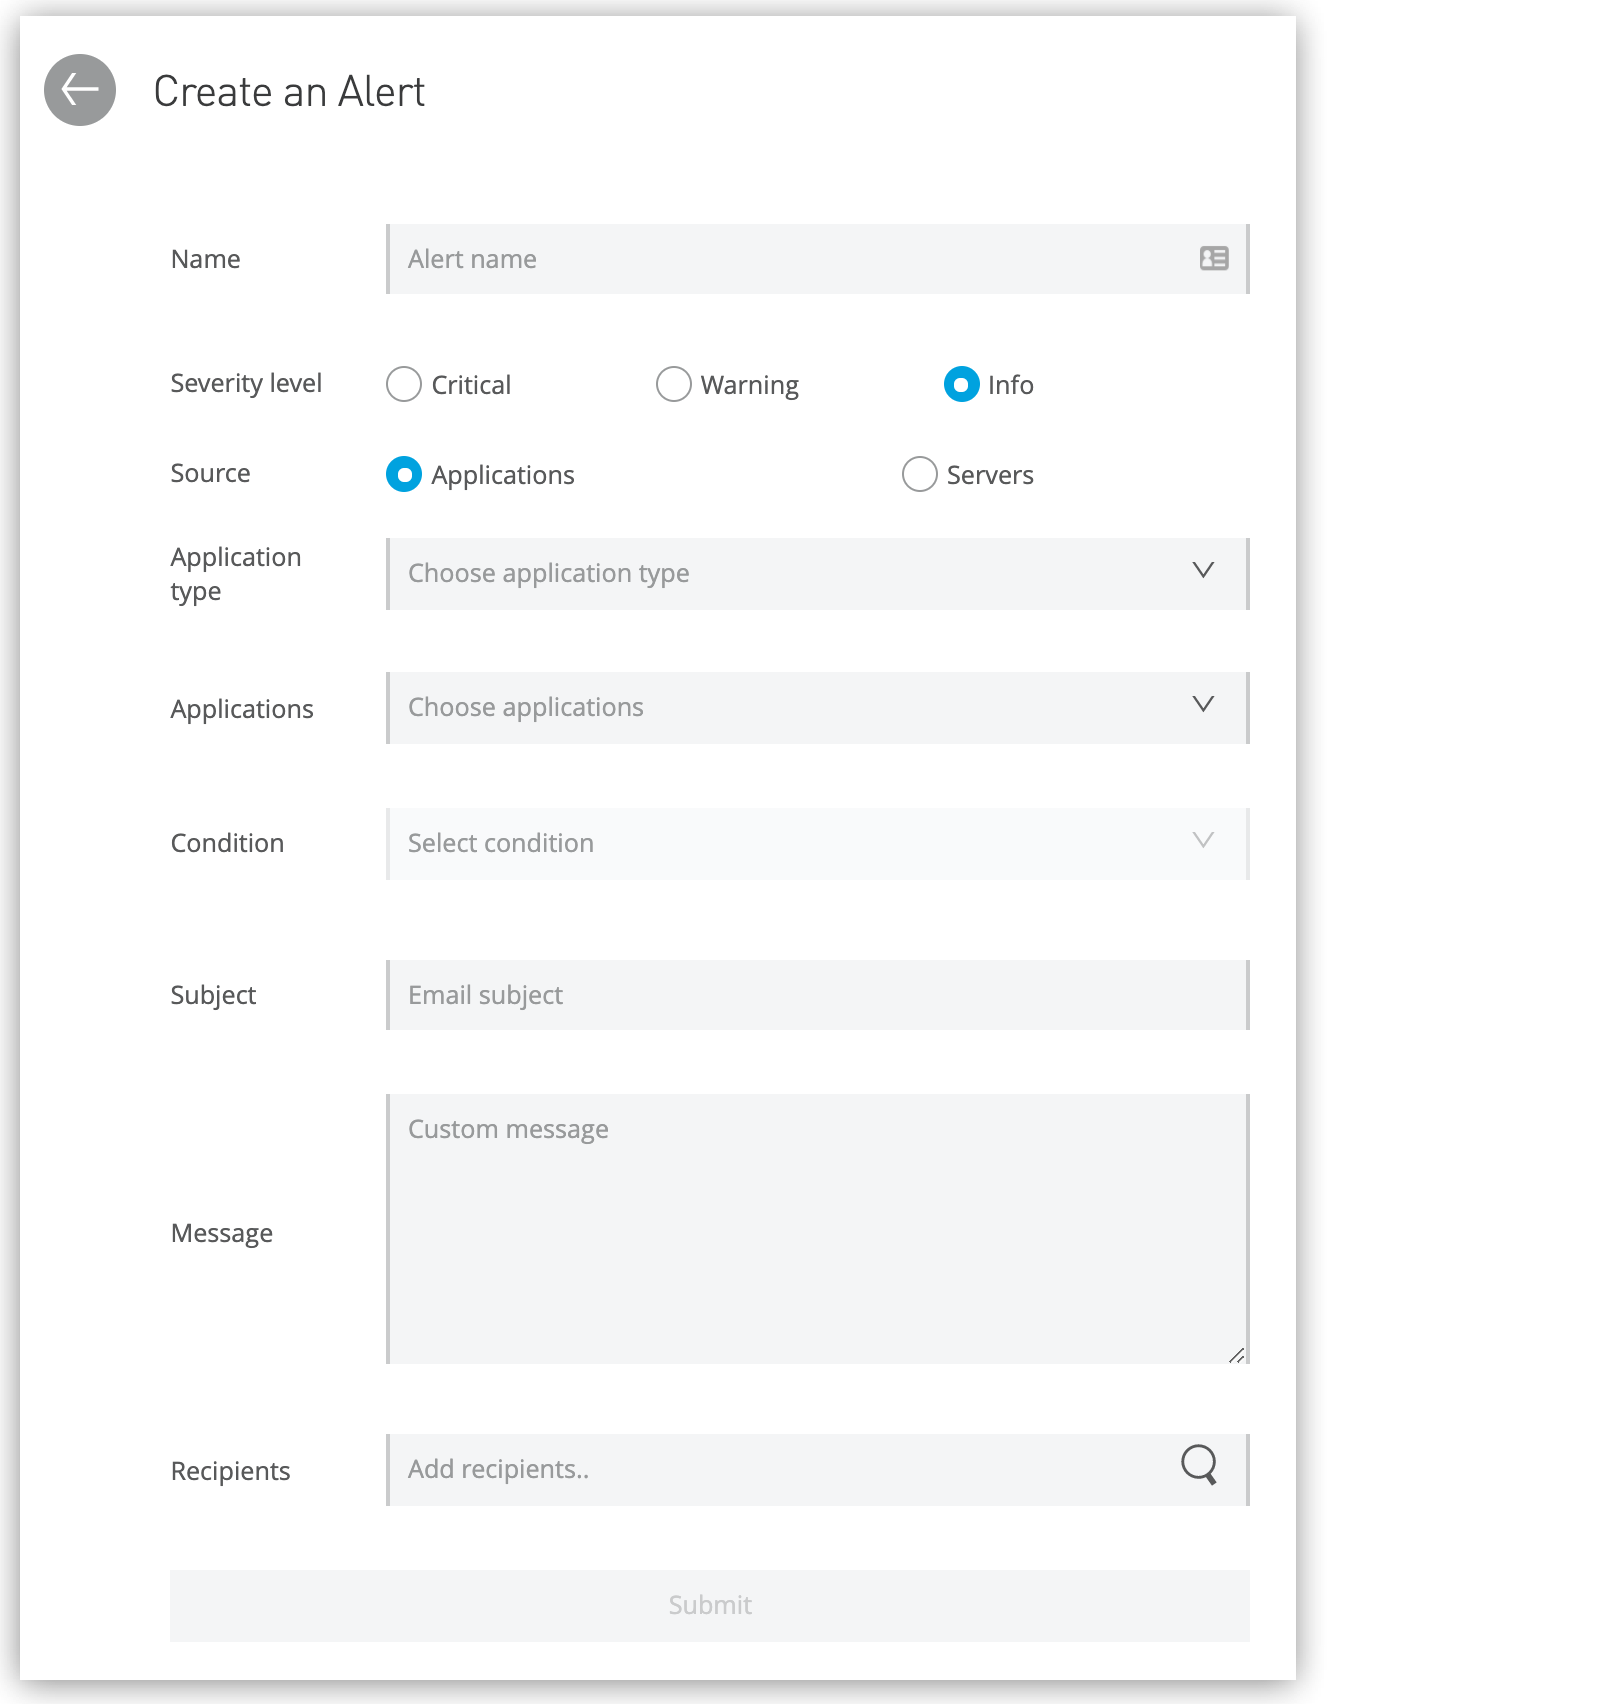
Complete the required fields:
-
Name
Unique and meaningful name for the alert
The Name is limited to 256 characters.
-
Severity level
Severity of the alert: Critical, Warning, or Info
-
Source
The source of the alert: servers
This field appears only if your Anypoint Platform account supports local servers.
-
Server type
When the source is Servers, the type of server: single server, server group, or cluster.
If your servers aren’t available on your menu, see Servers, Server Groups, and Clusters.
-
Servers
The server to apply the alert to
-
Condition
The condition that triggers the alert
The available options depend on whether your alert is linked to a server. Some conditions require additional data. See Alert Conditions.
-
Subject
The subject of the alert email to send when the alert is triggered
The subject can include variables. See Alert Variables.
-
Message
The body text for the email to send when the alert is triggered. The message body can include variables. See Alert Variables.
-
Recipients
The recipients of the alert email
You can select up to 20 platform user IDs and enter up to 20 email addresses.
-
-
Click Create Alert.
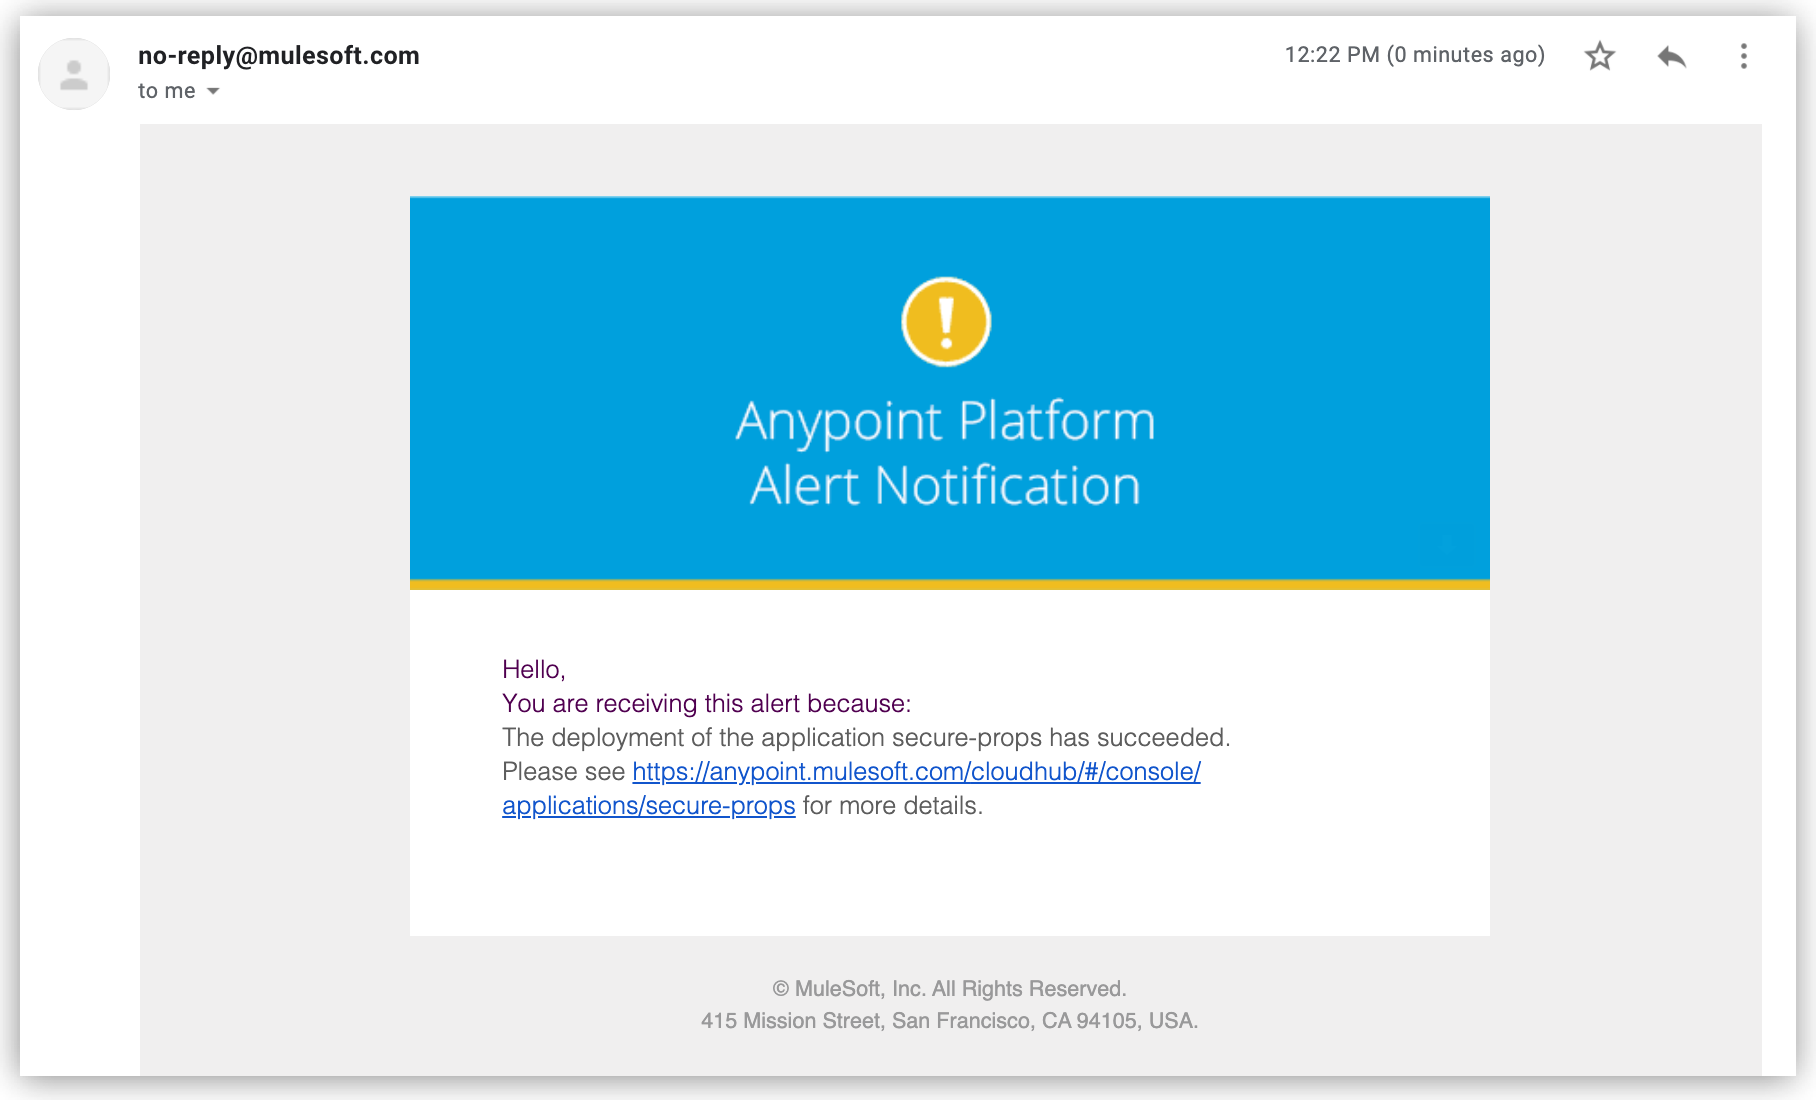
When an alert condition is triggered, Runtime Manager sends email notifications similar to this:
Alert Conditions
Configure specific conditions that trigger notifications based on your infrastructure monitoring requirements. Alert conditions range from simple status notifications to complex performance threshold monitoring.
Performance and Resource Monitoring
These performance alerts apply to all infrastructure types (servers, server groups, and clusters):
- Server CPU Usage
-
Monitor CPU utilization across your infrastructure. Triggers when CPU usage exceeds the specified percentage for the configured duration.
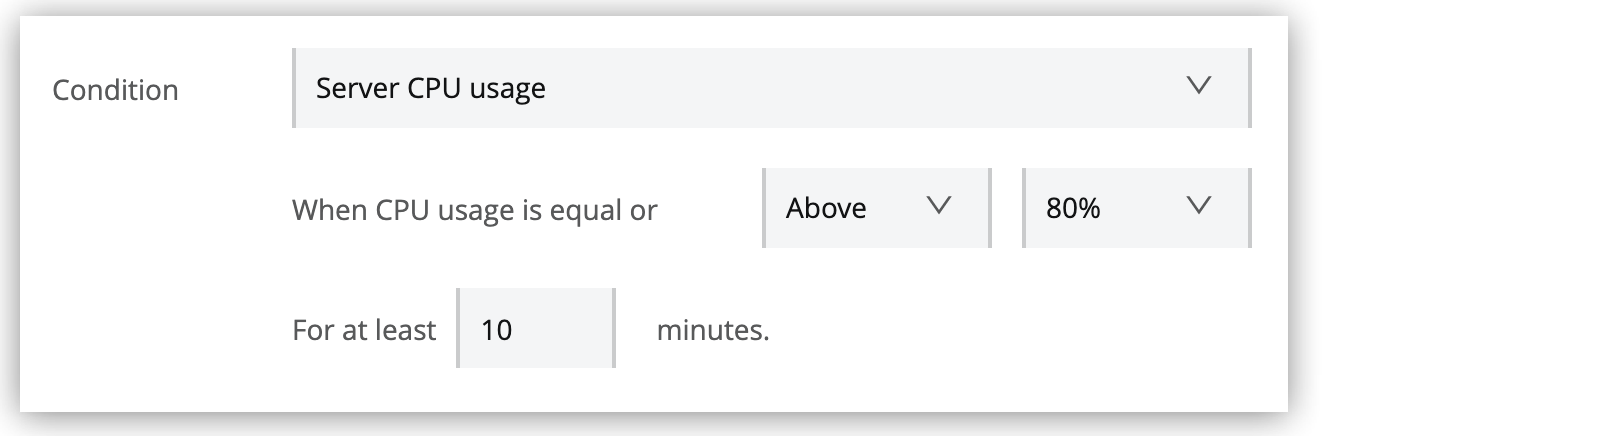
Configuration: Set the CPU percentage threshold and monitoring duration.
- Server Load Average
-
Monitor system processing load. Triggers when the average processing load exceeds the specified threshold for the configured duration.

Configuration: Set the load average threshold and monitoring duration.
This metric isn’t available on Windows environments. - Server Memory Usage
-
Track memory consumption across your infrastructure. Triggers when memory usage (in MB) exceeds the specified threshold for the configured duration.
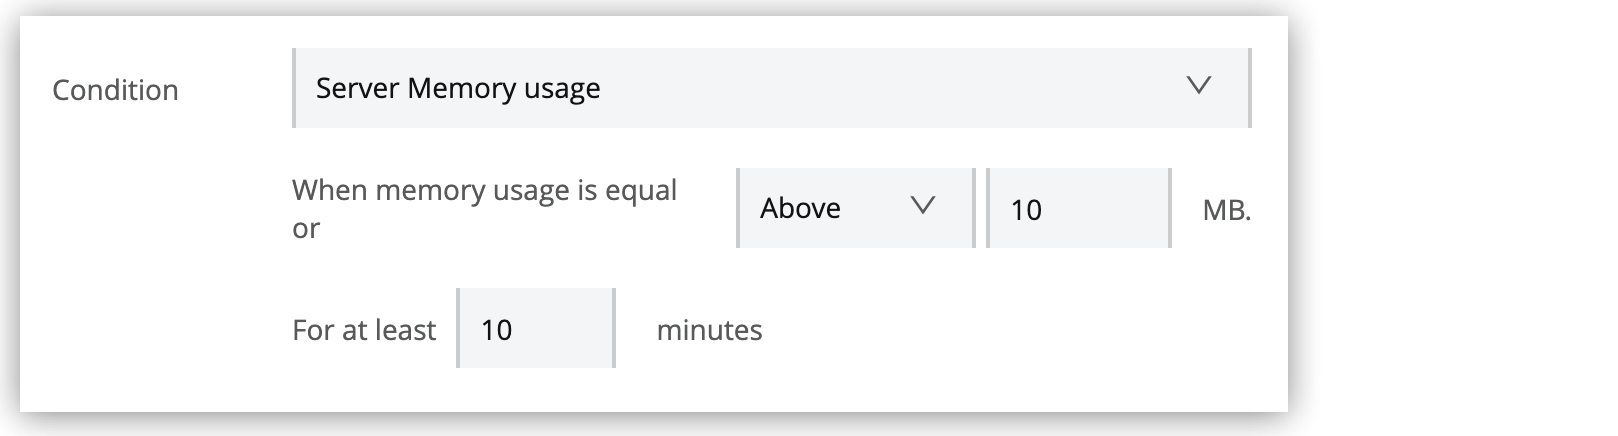
Configuration: Set the memory usage threshold (MB) and monitoring duration.
- Server Thread Count
-
Monitor JVM thread utilization. Triggers when the thread count exceeds the specified level for the configured duration.
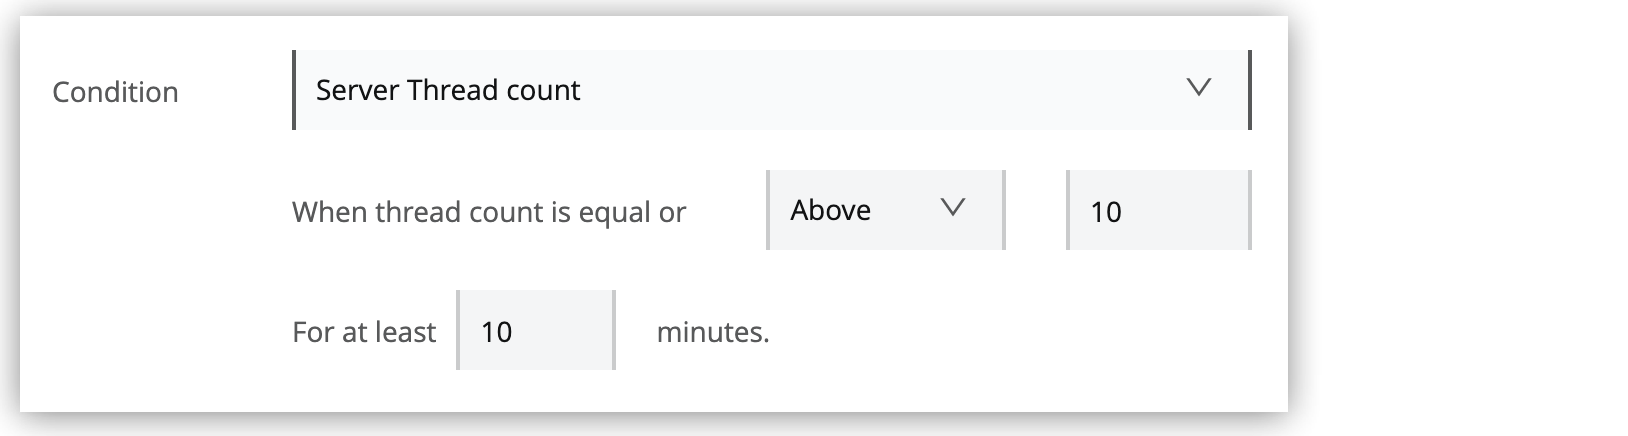
Configuration: Set the thread count threshold and monitoring duration.
These alerts vary according to the target type (server, server groups, or clusters) and require no additional parameters:
- Servers
-
-
Agent version changed
-
Runtime version changed
-
Server connected
-
Server deleted
-
Server disconnected
-
- Server Groups
-
-
Server Group connected
-
Server Group deleted
-
Server Group disconnected
-
Server Group’s node connected
-
Server Group’s node disconnected
-
Server added to Server Group
-
Server removed from Server Group
-
- Clusters
-
-
Cluster connected
-
Cluster deleted
-
Cluster disconnected
-
Cluster presents visibility issues
-
Cluster’s node connected
-
Cluster’s node disconnected
-
Server added to Cluster
-
Server removed from Cluster
-
Alert Variables
Customize alert email subjects and messages using dynamic variables that provide contextual information about triggered events.
You can’t use the character combination $& in variable expressions.
|
| Alert Category | Alert Type | Available Variables |
|---|---|---|
All Alerts |
|
|
Server Alerts |
All Server Alerts |
|
Agent version changed |
|
|
Runtime version changed |
||
Server CPU usage |
|
|
Server Load average |
||
Server Memory average |
||
Server Thread count |
||
Server Group Alerts |
All Server Group Alerts |
|
Server Group’s node CPU usage |
|
|
Server Group’s node Load average |
||
Server Group’s node Memory usage |
||
Server Group’s node Thread count |
||
Server Group’s node connected |
|
|
Server Group’s node disconnected |
||
Server added to Server Group |
||
Server removed from Server Group |
||
Cluster Alerts |
All Cluster Alerts |
|
Cluster’s node CPU usage |
|
|
Cluster’s node Load average |
||
Cluster’s node Memory usage |
||
Cluster’s node Thread count |
||
Cluster’s node disconnected |
|
|
Cluster’s node connected |
|
|
Server added to Cluster |
||
Server removed from Cluster |
||
| Variable | Definition |
|---|---|
|
Name of the cluster |
|
Current value of metric that triggers the alert |
|
Above or Below |
|
Name of the server group |
|
Where to find more information about the alert |
|
Name of the node in a server group or cluster |
|
Name of the target (server, server group, or cluster) that triggers the alert |
|
New version number for the agent or runtime |
|
Previous version number for the agent or runtime |
|
Where to find more information about the alert on the node’s parent cluster |
|
Name of the resource, such as server or app, on the node’s parent cluster that triggers the alert |
|
Name of the infrastructure resource that triggers the alert |
|
Severity of the alert |
|
State of the resource that triggers the alert, such as Running or Disconnected |
|
Count over the period of time that triggers the alert |
Access and View Alerts
Runtime Manager provides multiple ways to access and monitor your infrastructure alert configurations and history.
Global Alert Management
Access all infrastructure alerts from the main alerts dashboard:
-
Click Alerts in the Runtime Manager navigation pane:
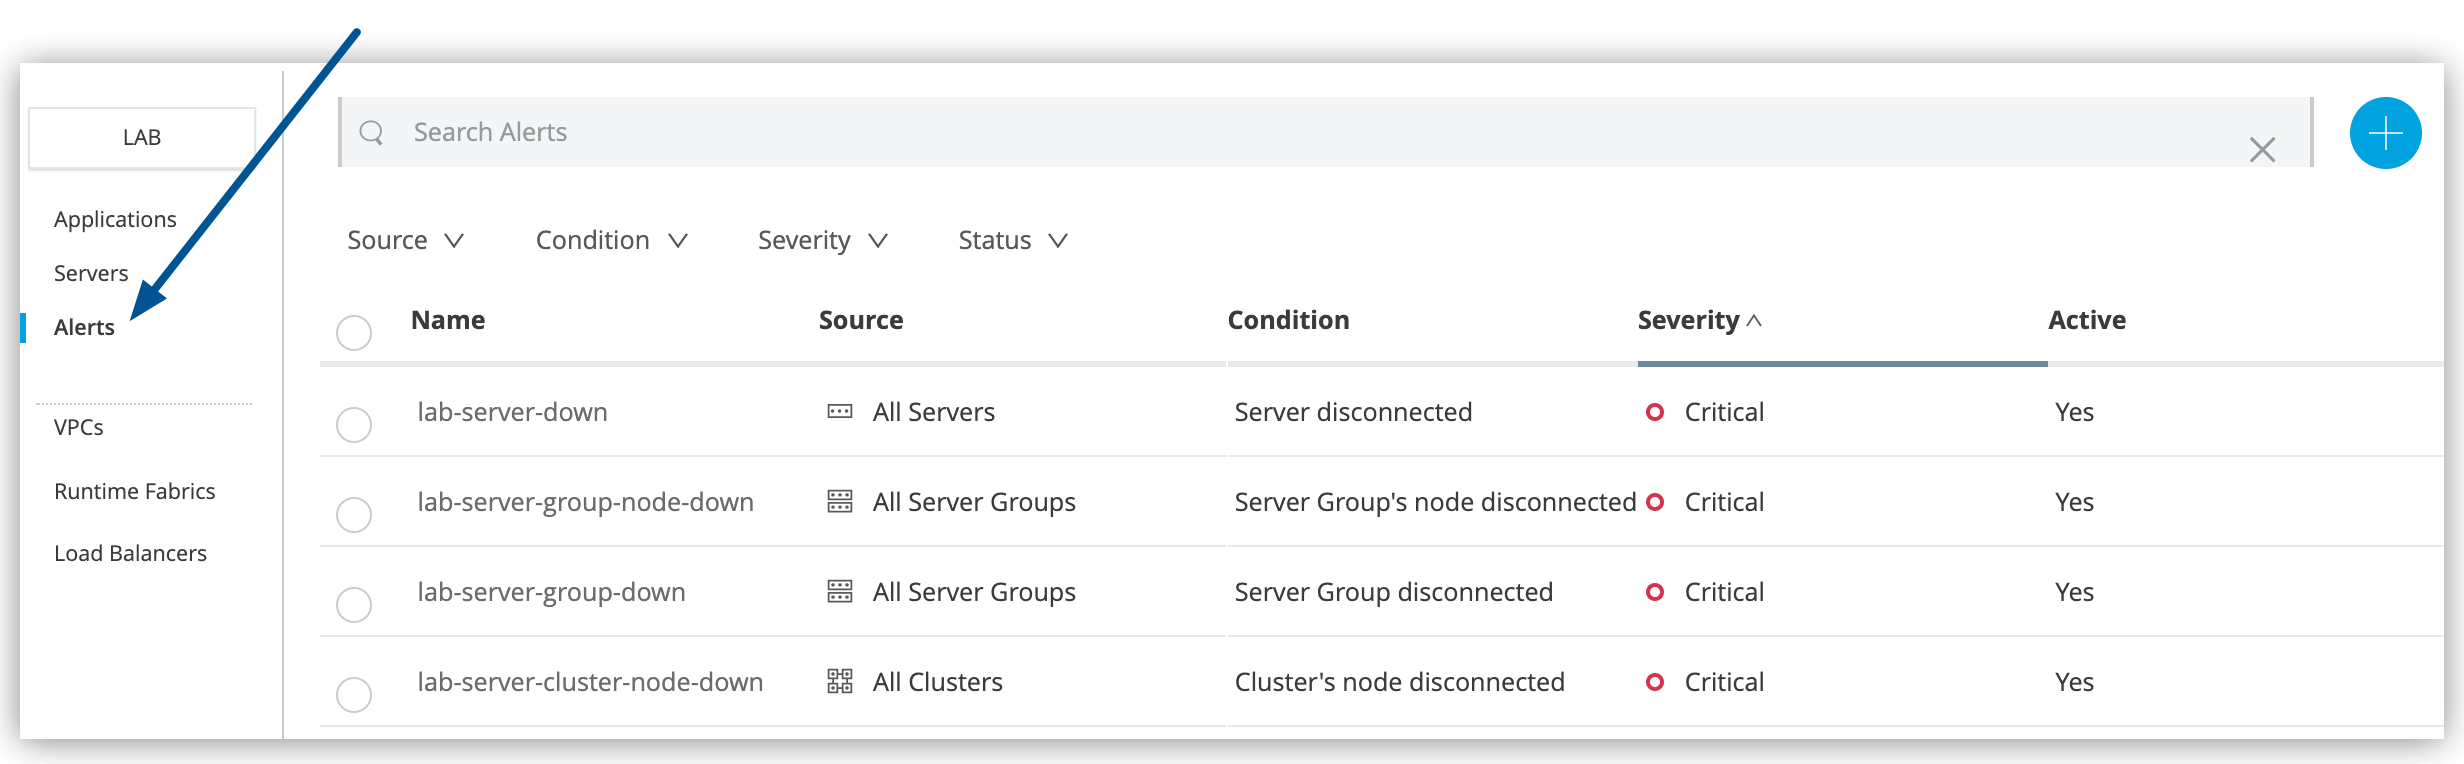 Figure 3. The arrow shows the Alerts menu.
From the alerts dashboard, you can:
-
Create new infrastructure alerts
-
Search alerts by name or configuration
-
Filter alerts by source, condition, severity, or status
-
Modify alert configurations by clicking alert names
-
View alert status, settings, and trigger history in the details pane:
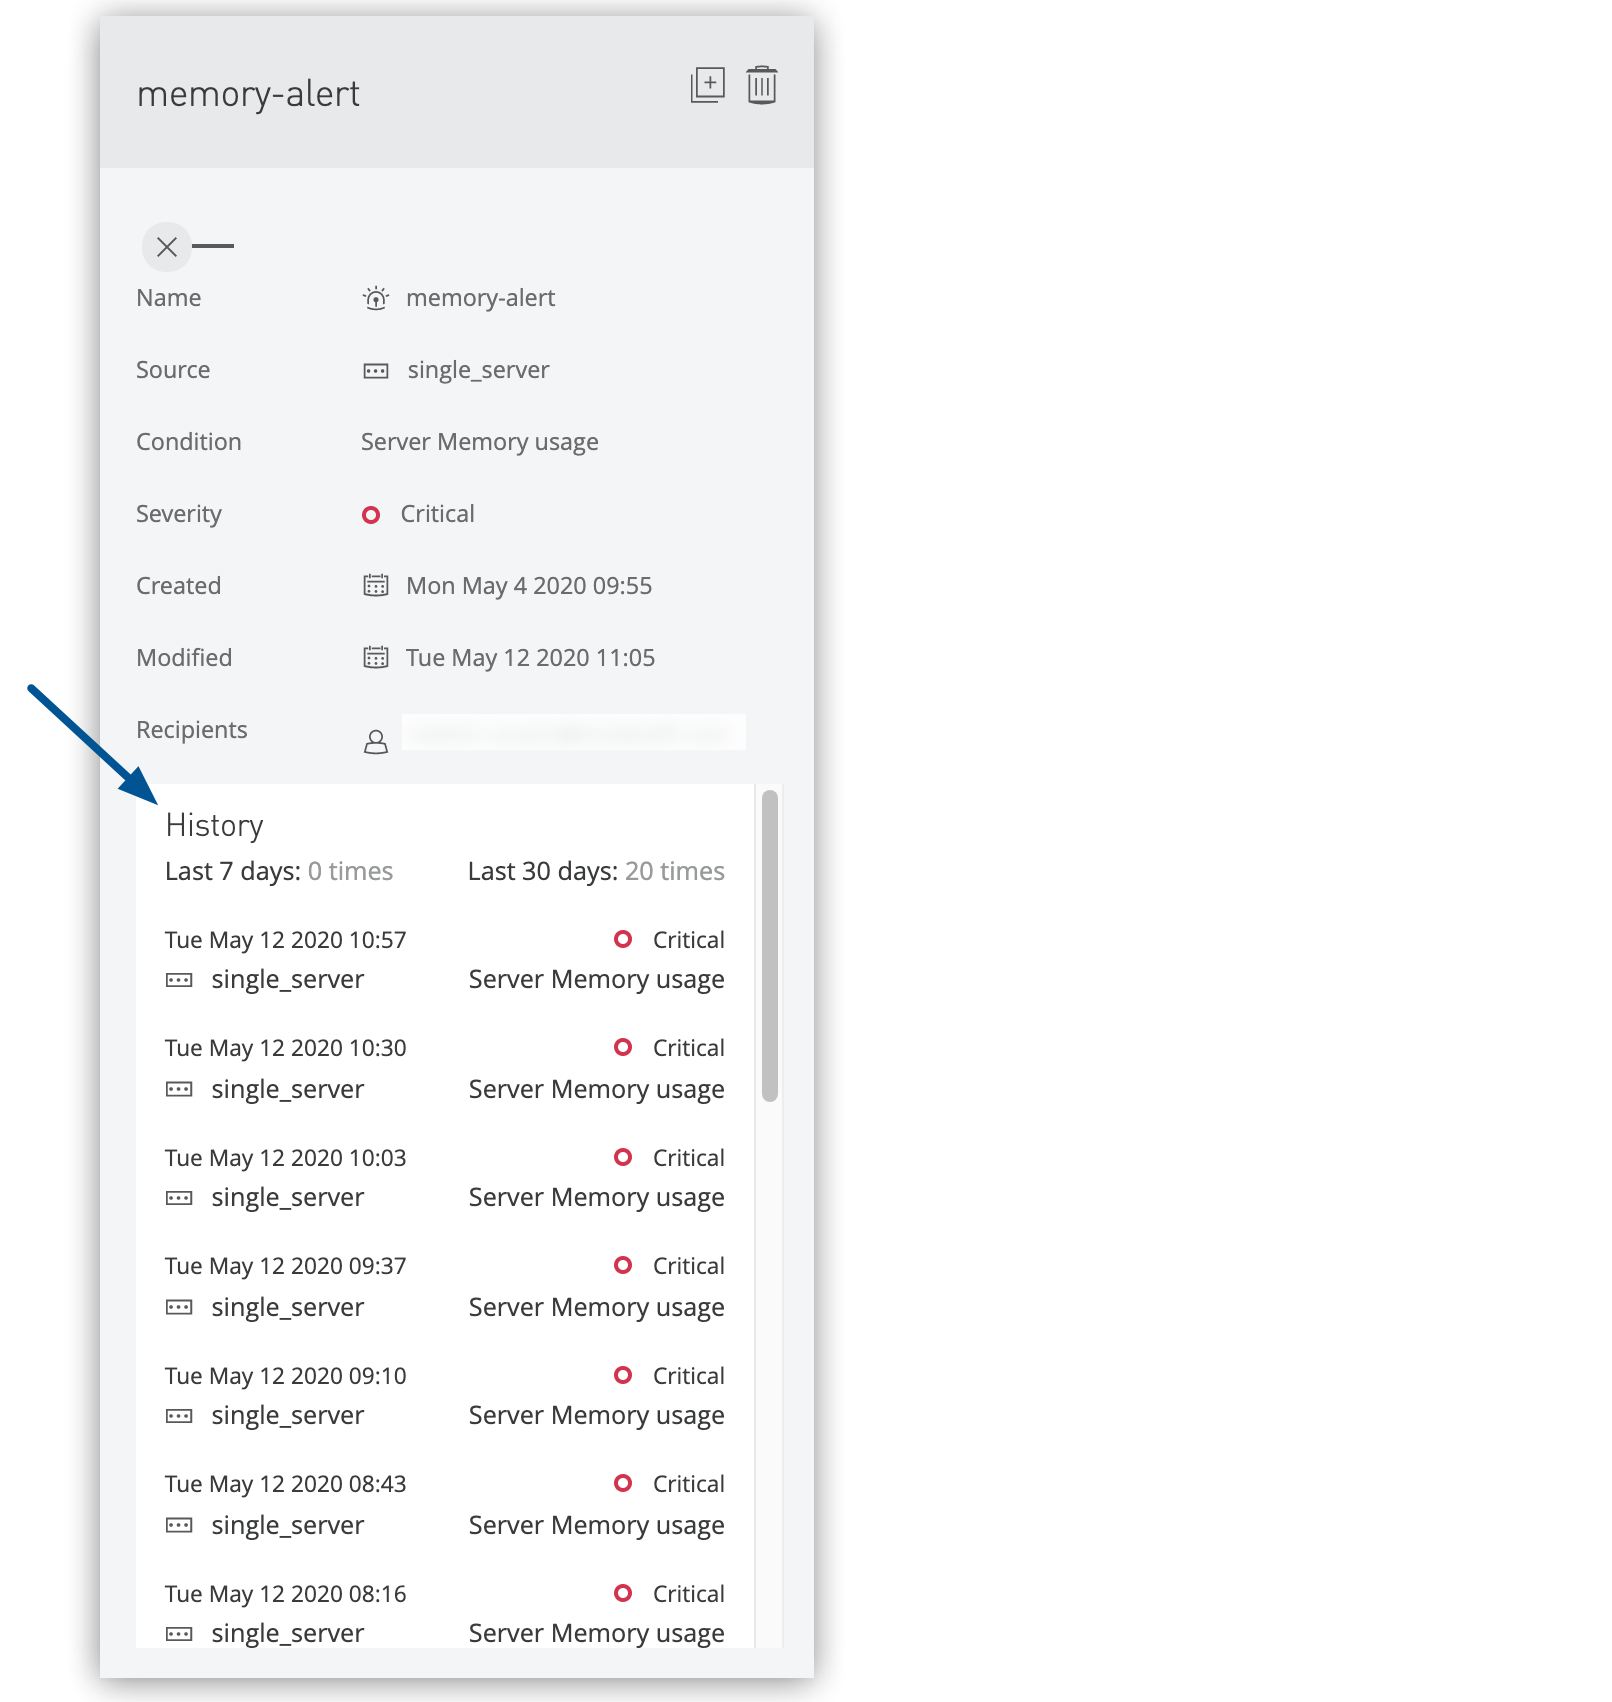 Figure 4. The arrow shows the alert history in the details pane.
Servers, Server Groups, and Clusters Alert Views
View alerts associated with specific servers, server groups, or clusters:
-
In the Servers list, click the Status column for your target server, server group, or cluster.
-
Click the View Associated Alerts link in the details pane:
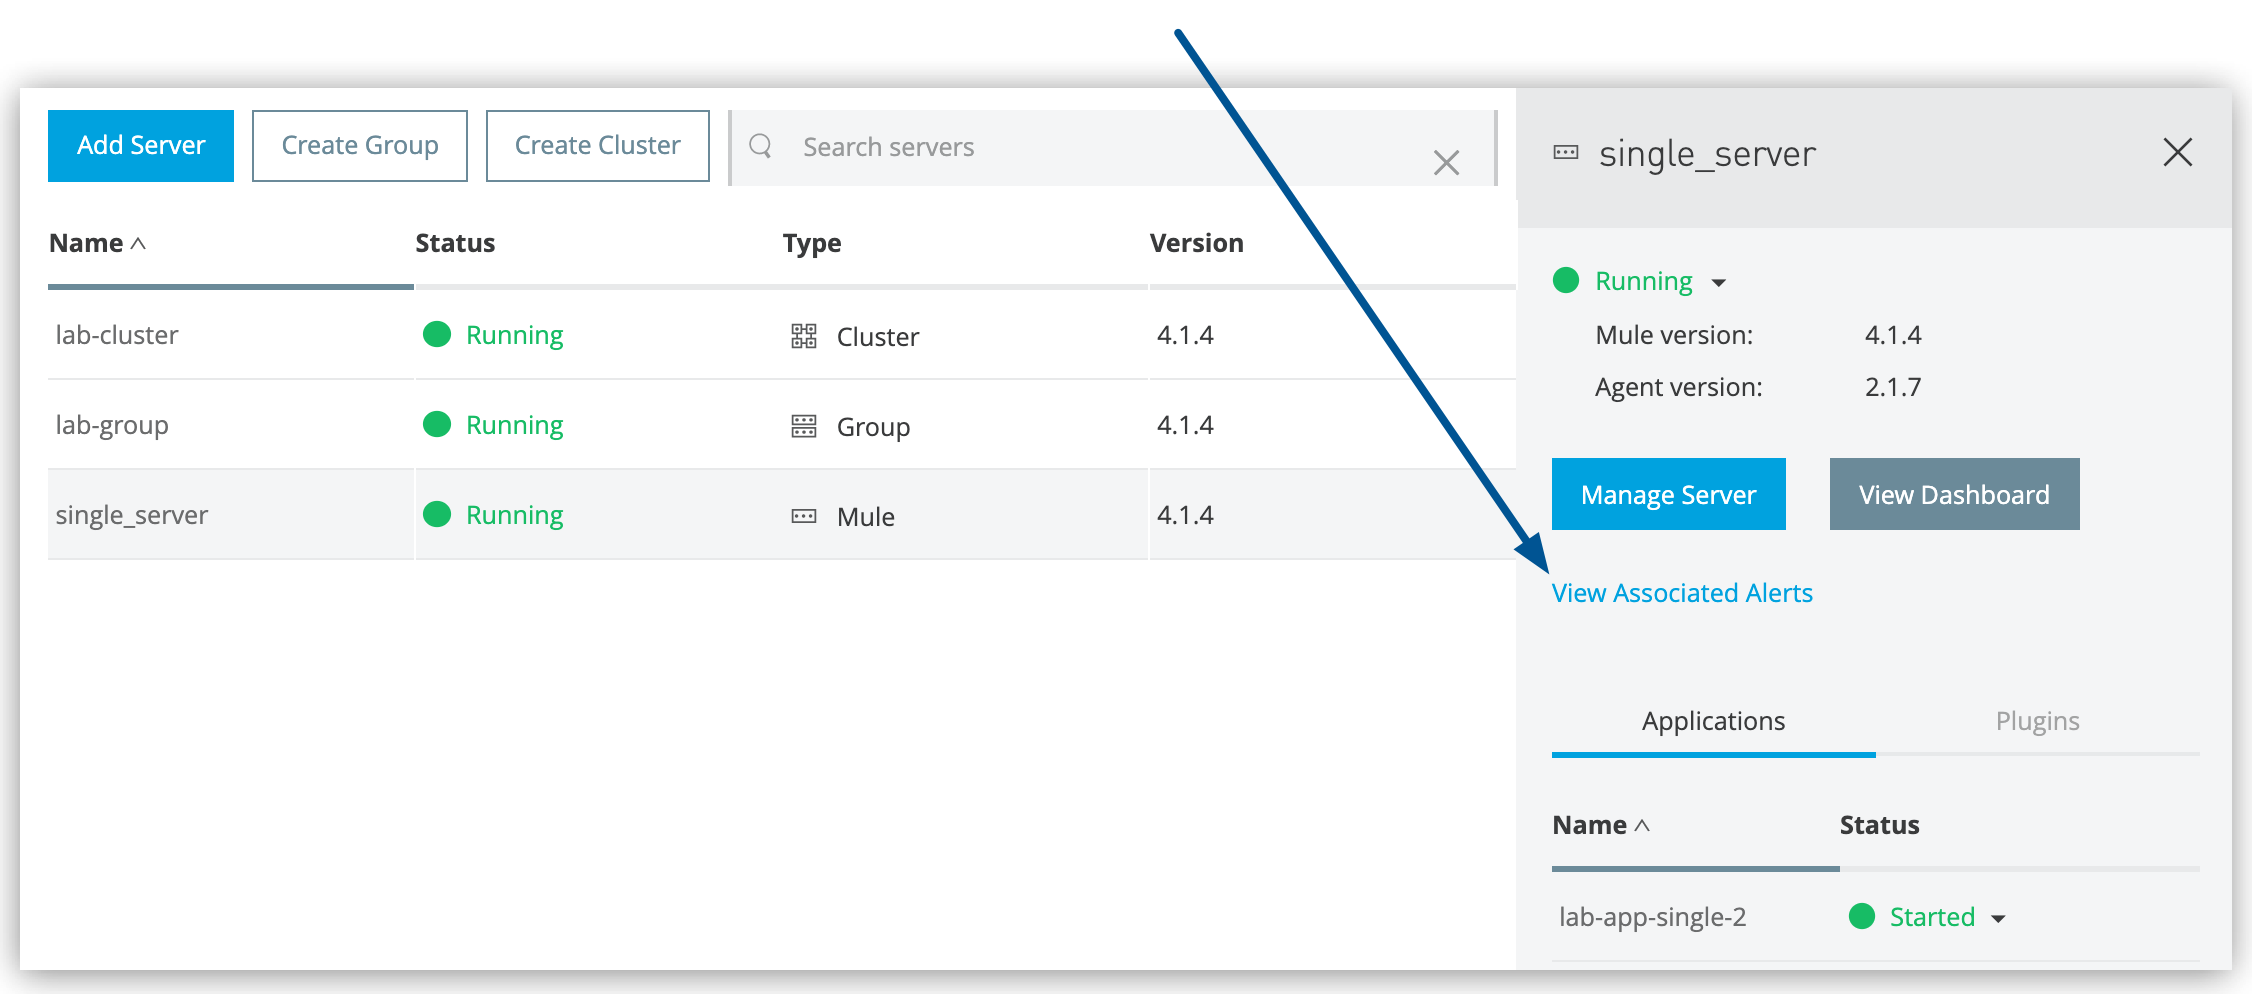 Figure 5. The arrow shows the View Associated Alerts link in the details pane.
Alert History by Servers, Server Groups, and Clusters
Review historical alert activity for specific servers, server groups, or clusters:
-
In the Servers list, click the name of your server, server group, or cluster.
-
Click Settings in the navigation pane.
-
Click the Alerts History tab:
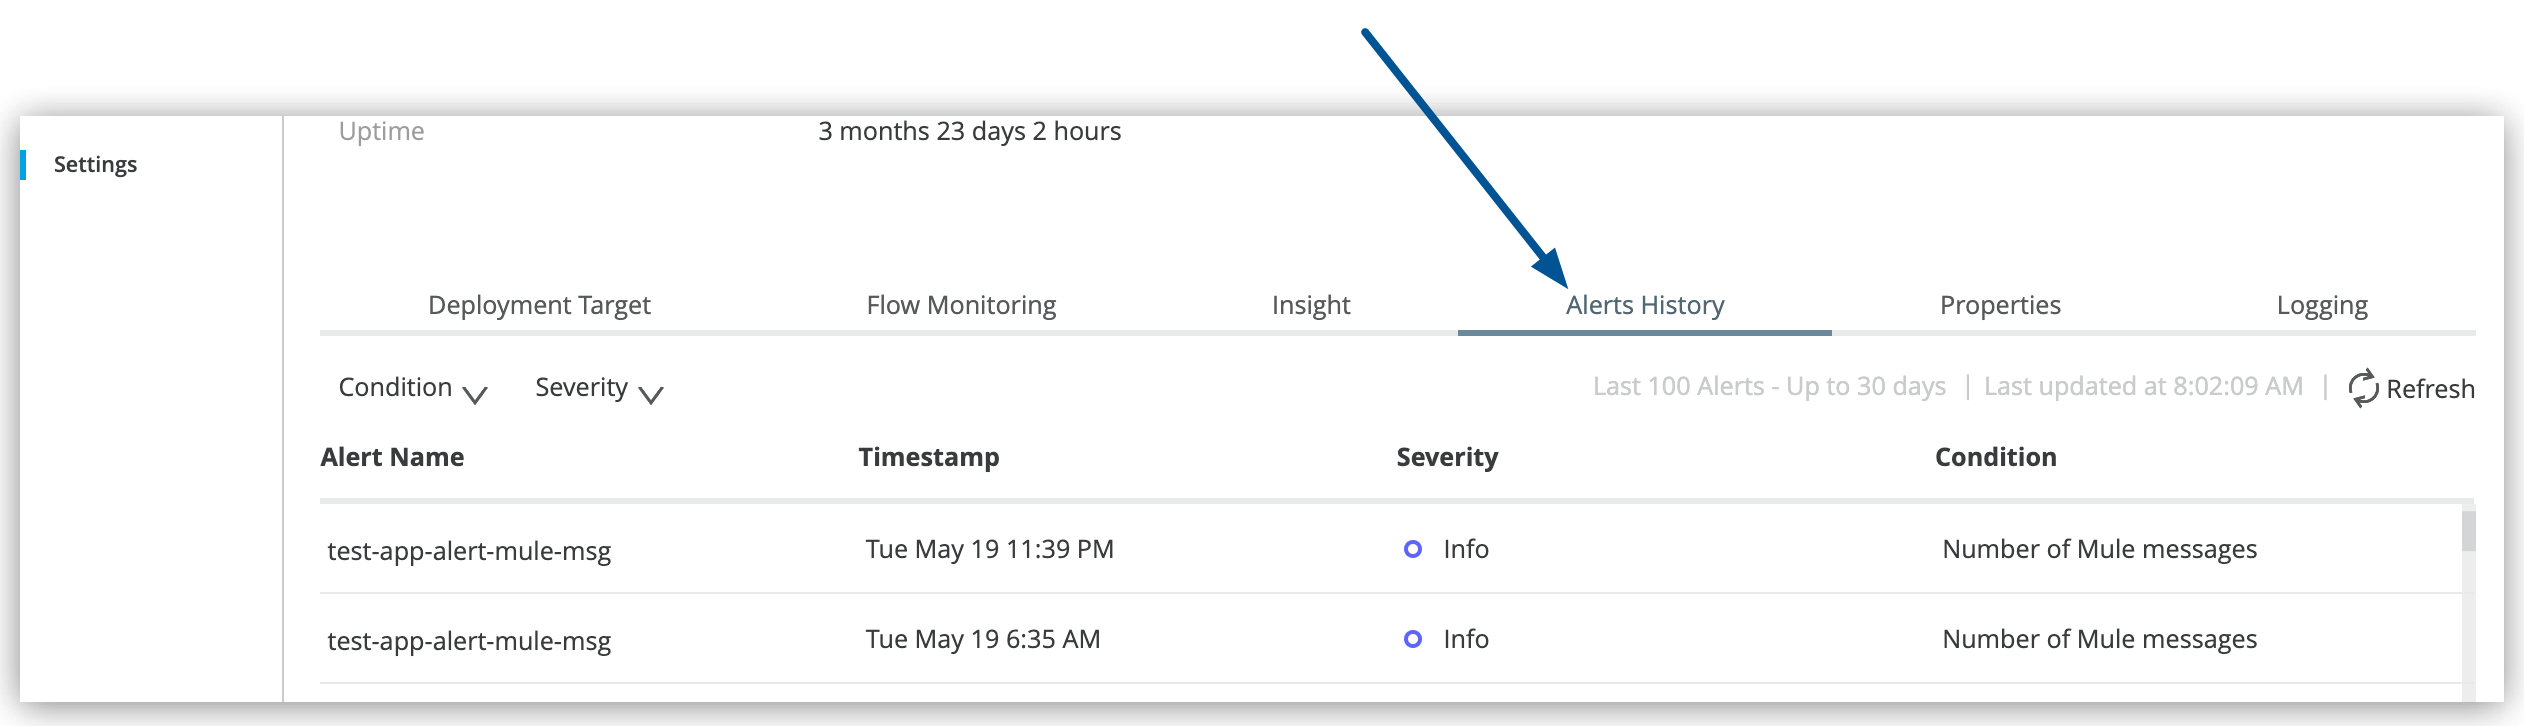 Figure 6. The arrow shows the Alerts History tab on the Settings page.
Manage Alerts
Efficiently manage your alert configurations through Runtime Manager’s alert management interface.
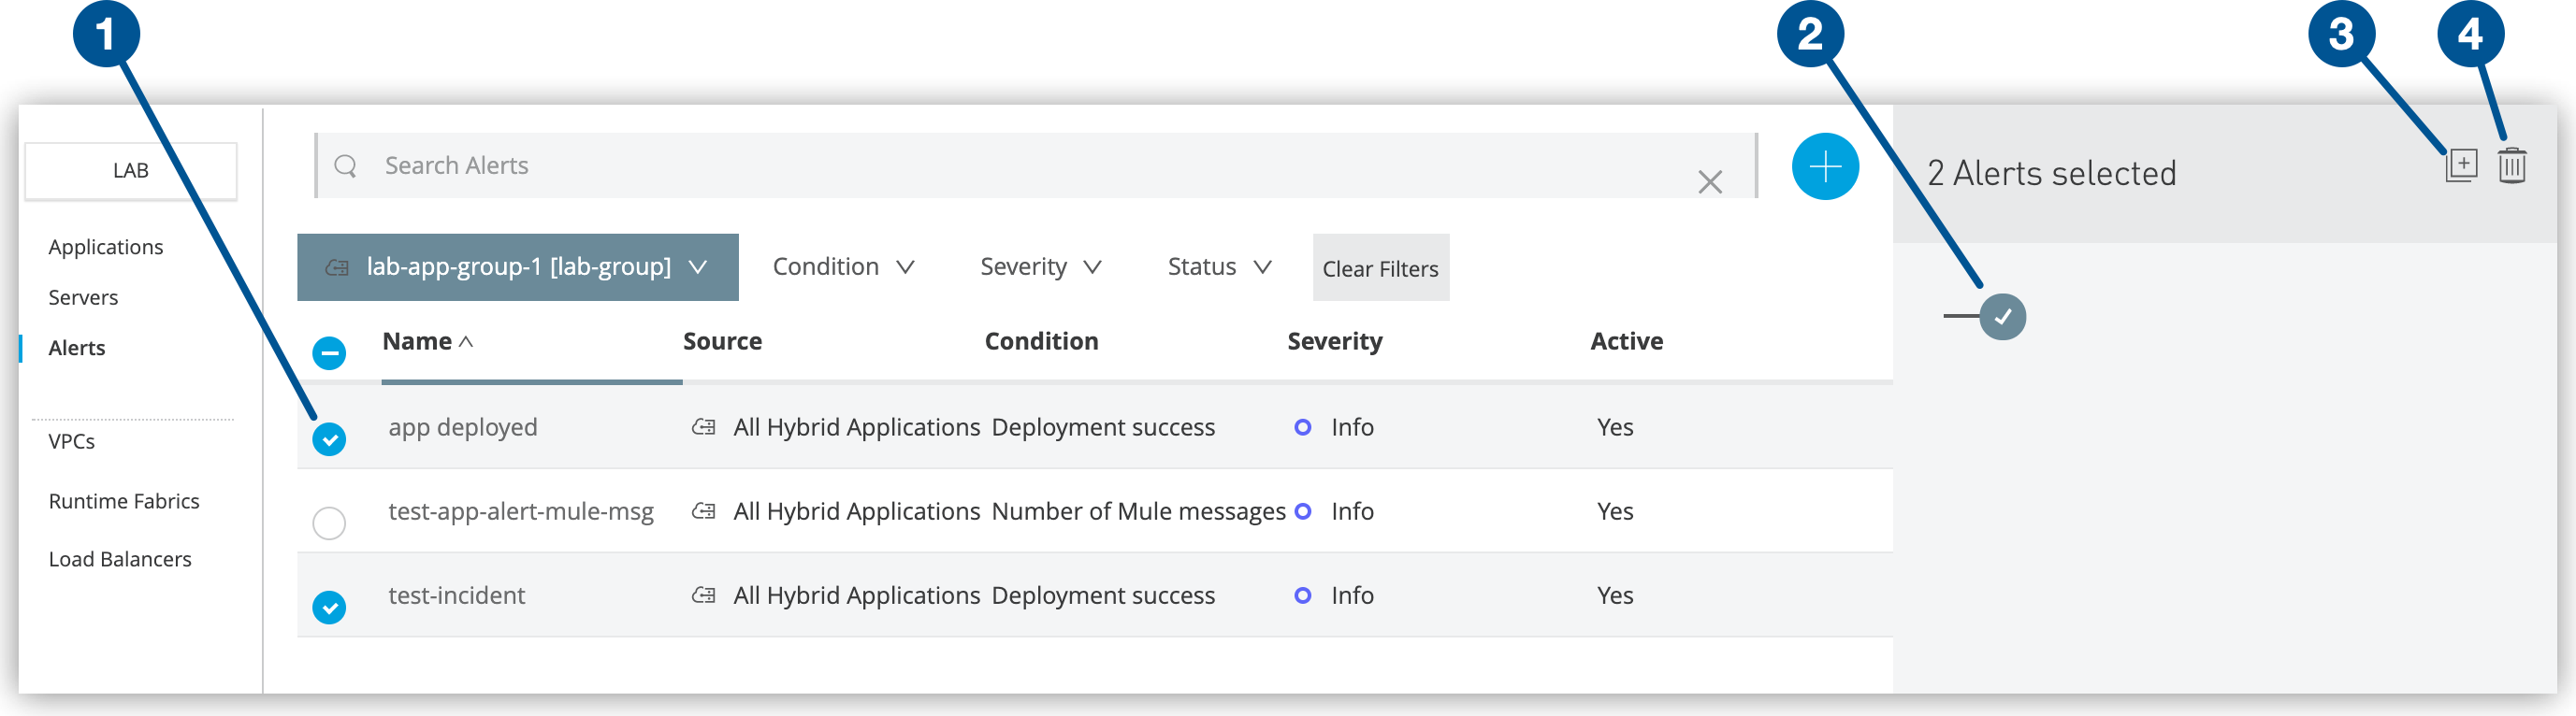
Alert Management Operations
From the Alerts page, select one or more alerts and use the management controls:
Enable and Disable Alerts
Control alert notification delivery for infrastructure monitoring:
-
Disable alerts: Click the toggle switch to turn off notifications:
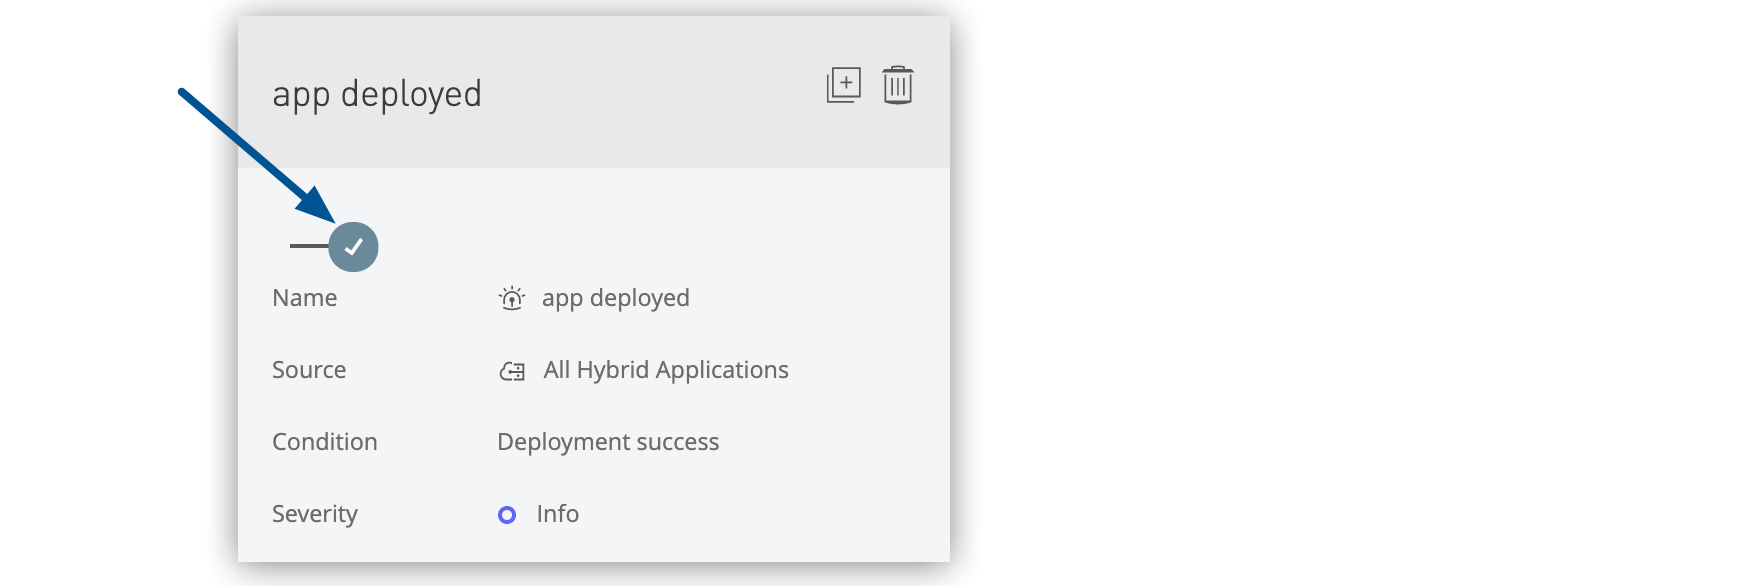 Figure 8. The arrow shows the alert switch on.
The Active column changes from Yes to No.
-
Enable alerts: Click the toggle switch to turn on notifications:
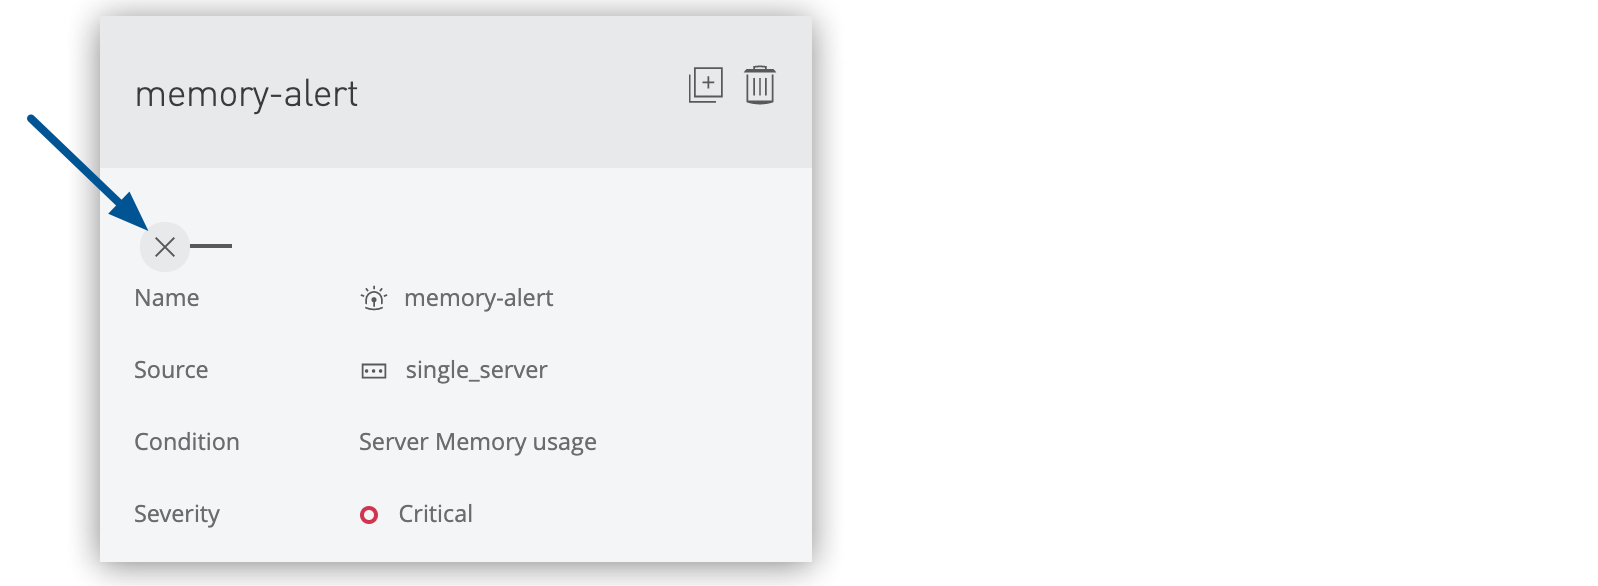 Figure 9. The arrow shows the alert switch off.
The Active column changes from No to Yes.
| Alert state changes affect all recipients of the alert notifications. |
Duplicate Alerts
Create copies of existing alert configurations for similar infrastructure components:
-
Select one or more alerts from the list.
-
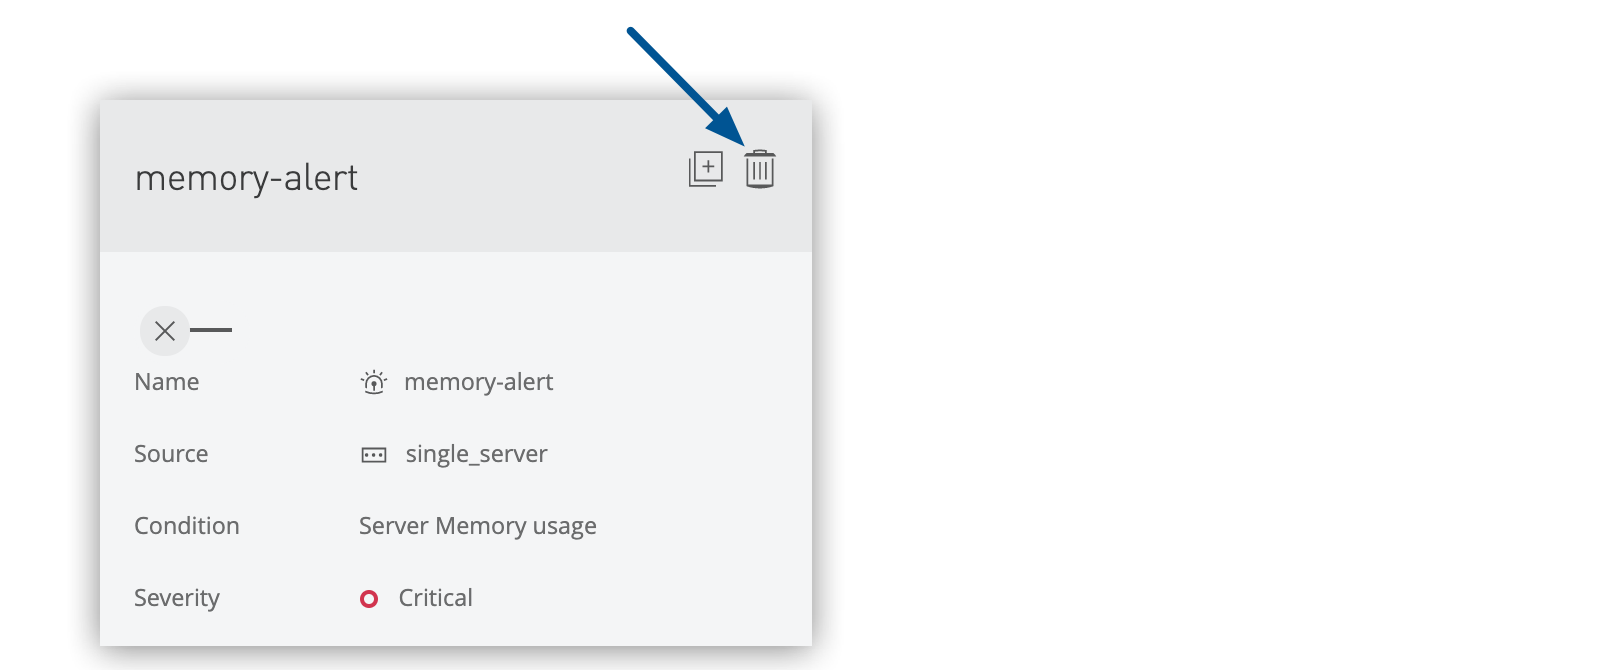
Click the Duplicate icon in the details pane:
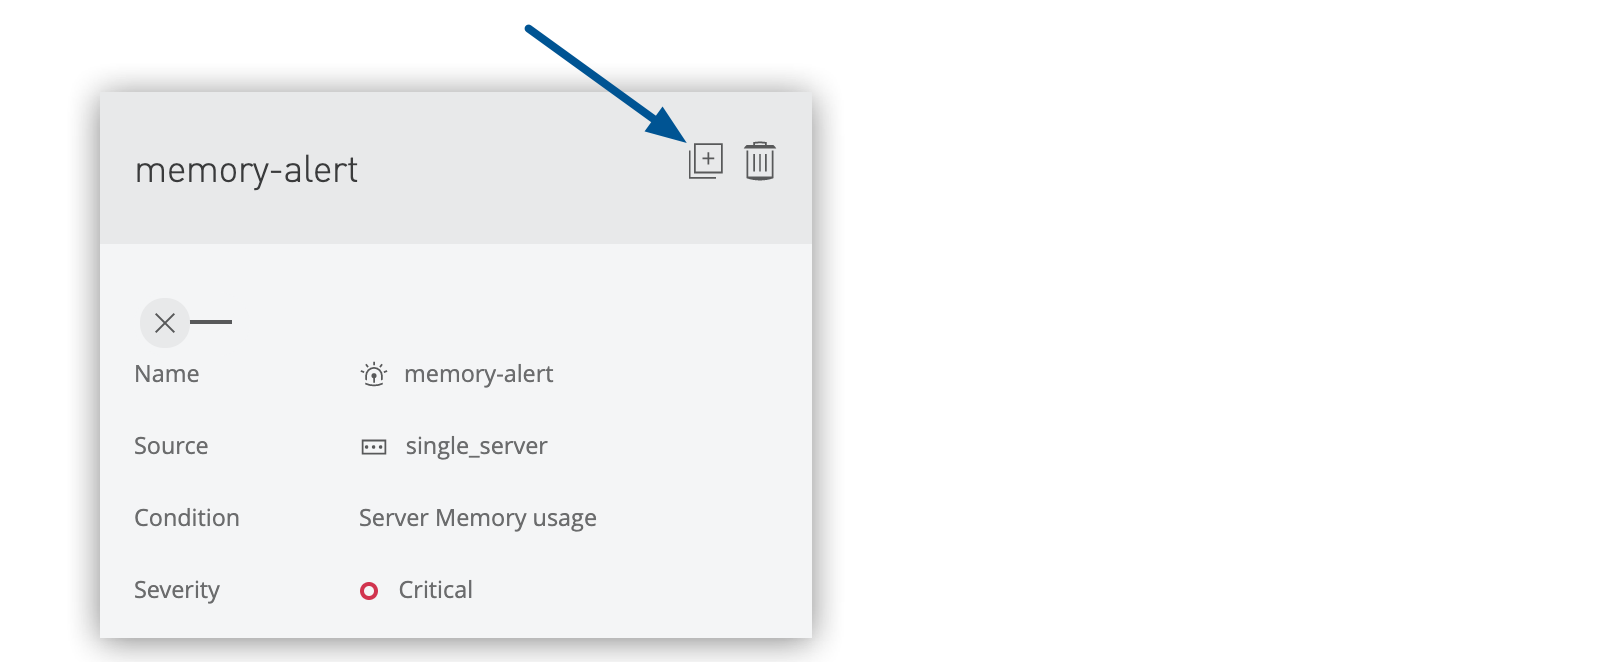 Figure 10. The arrow shows the Duplicate alert icon.
Runtime Manager creates alert copies with -copy appended to the original alert names.