Monitoring Dashboards for Servers, Server Groups, and Clusters
Monitor your hybrid standalone infrastructure through comprehensive performance dashboards that provide real-time visibility into server health, resource utilization, and system performance across your distributed runtime environment.
Overview
Runtime Manager provides comprehensive infrastructure monitoring dashboards for your hybrid standalone environment, so you can:
-
Monitor real-time server performance metrics and resource utilization
-
Analyze historical trends for capacity planning and optimization
-
Track JVM performance including memory usage, garbage collection, and thread activity
-
View aggregated metrics across server groups and clusters
-
Identify performance bottlenecks and system health issues
-
Make data-driven decisions for infrastructure scaling and maintenance
|
To view infrastructure dashboards, you must have the Runtime Manager Read Servers permission for the target servers. Anypoint Platform Private Cloud Edition doesn’t support the Anypoint Monitoring dashboard feature. |
Runtime Manager provides these infrastructure monitoring dashboards:
-
Server Monitoring Dashboard
Individual server performance metrics including CPU, memory, JVM heap usage, garbage collection, and detailed memory breakdown -
Server Group and Cluster Monitoring Dashboard
Aggregated performance metrics for servers organized in groups or clusters with comparative analysis capabilities
Server Monitoring Dashboard
Monitor individual server performance through comprehensive dashboards that provide real-time visibility into system resources, JVM metrics, and operational health indicators.
The server monitoring dashboard provides detailed insights into your hybrid standalone server performance, including:
-
System resource utilization (CPU, memory, disk I/O)
-
JVM heap and non-heap memory allocation and usage
-
Garbage collection performance and frequency
-
Thread management and execution metrics
-
Memory breakdown by allocation pools (Eden, Survivor, Old Generation)
-
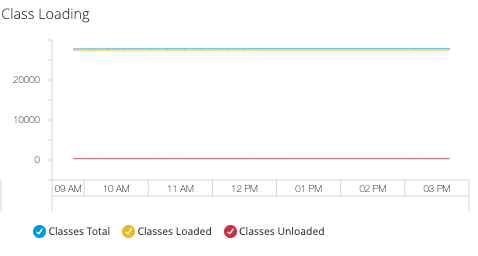
Class loading and code cache utilization
Access Server Dashboard
To access the server monitoring dashboard:
-
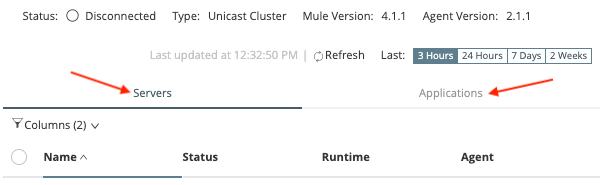
In Runtime Manager, click Servers.
-
Click the name of the server to monitor.
The server dashboard displays with comprehensive performance metrics:
You can also navigate to individual server dashboards from the server group or cluster dashboard by clicking individual server names.
Dashboard Navigation and Features
The server monitoring dashboard provides two complementary tab views for comprehensive performance analysis:
-
Overview
High-level system metrics including CPU usage, heap memory, and overall server health -
Breakdown
Detailed JVM memory analysis with individual allocation pools and garbage collection metrics
Time Range Selection
Monitor performance across different time periods using the time range selector:

Available time ranges include:
-
3 Hours: Real-time monitoring with minute-level granularity
-
24 Hours: Recent performance with 8-minute averaging
-
7 Days: Weekly trends with hourly data points
-
2 Weeks: Historical analysis with 2-hour averaging
Interactive Data Exploration
Enhance your analysis with interactive dashboard features:
-
Display numerical values and timestamps by hovering over graph points
-
When multiple applications run on the server, filter performance data by specific applications using the application checkboxes
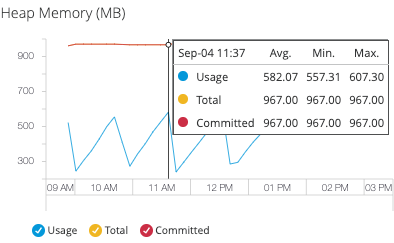
The memory usage graphs on the dashboards track these values:
-
Usage
Current memory consumption (MB) - indicates active memory allocation -
Total
Maximum available memory (MB) - represents the upper limit for memory allocation -
Committed
Memory guaranteed by the JVM (MB) - always greater than or equal to used memory
| If the JVM attempts to increase used memory beyond committed memory, allocation fails even when total memory is available. Monitor committed vs. used memory ratios for optimal performance. |
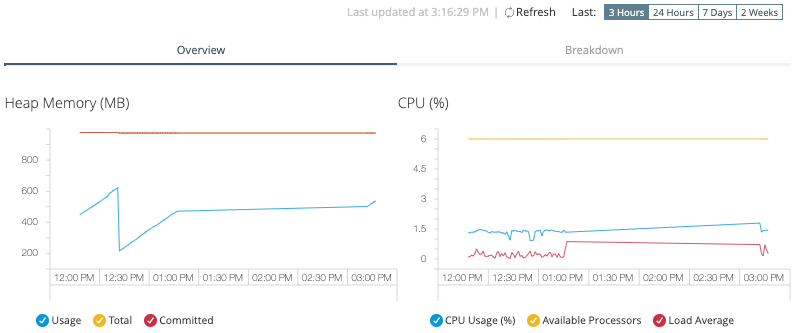
Overview Tab
The Overview tab provides essential system health metrics for rapid assessment of server performance and resource utilization.
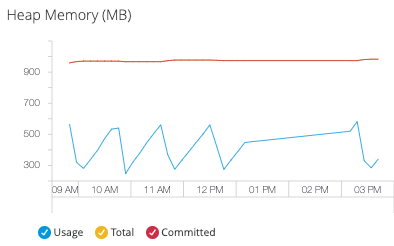
Heap Memory
Monitor JVM heap memory allocation and usage patterns to optimize application performance:
-
Heap Memory Usage: Current heap allocation in MB
-
Total Heap Memory: Maximum heap size configured for the JVM
-
Heap Committed Memory: Memory guaranteed by the JVM for heap operations
Use heap memory metrics to:
-
Identify memory leaks and excessive allocation patterns
-
Optimize JVM heap size configuration (
-Xmxand-Xmsparameters) -
Plan capacity for application deployment and scaling
| If heap usage consistently approaches total memory, consider increasing heap size or analyzing application memory usage patterns. See the Breakdown Tab for detailed memory pool analysis. |
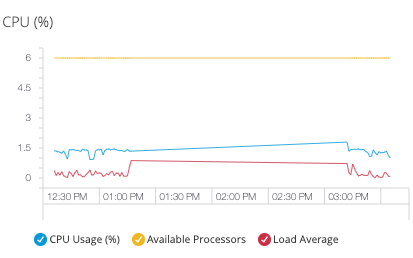
CPU
Track processor utilization and system load to ensure optimal server performance:
| CPU metrics are not available on Windows environments due to platform-specific monitoring constraints. |
-
CPU Usage
Percentage of processing capacity utilized -
Available Processors
Number of CPU cores available to the JVM -
Load Average
Average number of processes waiting for CPU execution
Load Average Interpretation:
-
Load < CPU Count: System has spare processing capacity
-
Load = CPU Count: System is optimally utilized
-
Load > CPU Count: System is experiencing processing pressure and potential performance degradation
Breakdown Tab
The Breakdown tab provides detailed JVM memory analysis with granular metrics for each memory pool, enabling precise performance tuning and troubleshooting.
JVM Memory Architecture
Understanding JVM memory organization is essential for effective performance monitoring:
-
Heap Memory Pools
-
Non-Heap Memory Areas
- Eden Space
-
Monitor the primary object allocation area for young generation garbage collection optimization:
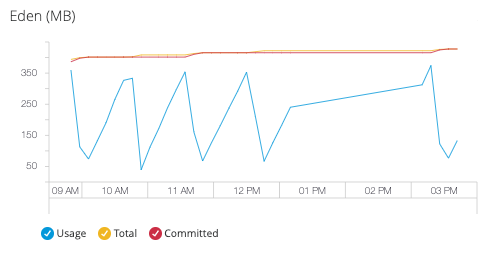
Eden space metrics help you:
-
Optimize object allocation patterns
-
Tune young generation garbage collection frequency
-
Identify excessive short-term object creation
-
- Survivor Space
-
Track intermediate object storage for garbage collection lifecycle analysis:
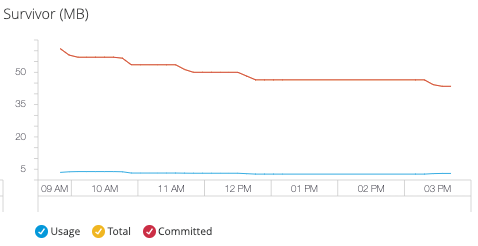
Survivor space monitoring enables:
-
Analysis of object promotion patterns to old generation
-
Optimization of survivor space sizing for GC efficiency
-
Detection of objects with intermediate lifespans
-
- Old Generation
-
Monitor long-term object storage and major garbage collection patterns:
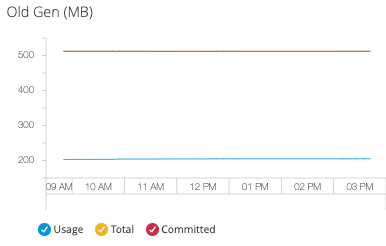
Old generation metrics provide insight into:
-
Long-lived object accumulation patterns
-
Major garbage collection frequency and impact
-
Memory leak detection through trend analysis
-
- Code Cache
-
Monitor JIT compiler performance and native code storage:
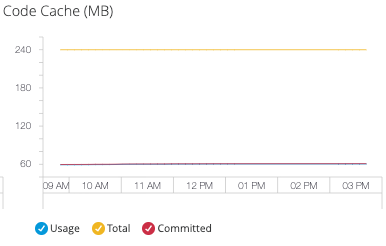
Code cache metrics help optimize:
-
JIT compilation effectiveness
-
Native code storage allocation
-
Application startup and runtime performance
-
- Compressed Class Space
-
Track compressed ordinary object pointer (OOP) storage efficiency:
This metric is available only when using JDK 8+.
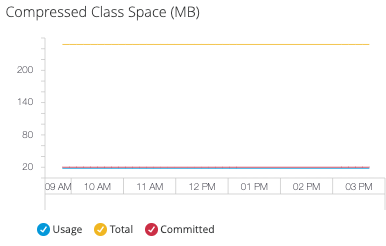
Monitor compressed class space for:
-
Memory efficiency of compressed OOPs
-
Class metadata storage optimization
-
JVM memory footprint reduction
-
- Metaspace
-
Monitor class metadata storage using native memory allocation:
This metric is available only when using JDK 8+.
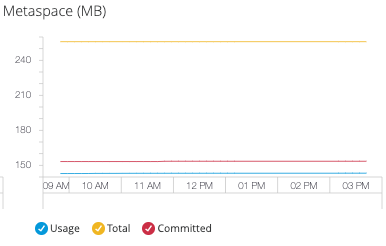
Key Considerations:
-
256 MB metaspace allocation
-
Uses system memory outside JVM heap
-
Grows automatically based on class loading requirements
Metaspace monitoring helps:
-
Prevent class metadata memory exhaustion
-
Optimize class loading and unloading patterns
-
Manage application deployment in memory-constrained environments
-
System Performance Metrics
Monitor JVM runtime performance and system behavior through these key performance indicators:
- Thread Count
-
Track JVM thread usage to identify concurrency issues and optimize thread pool configuration:
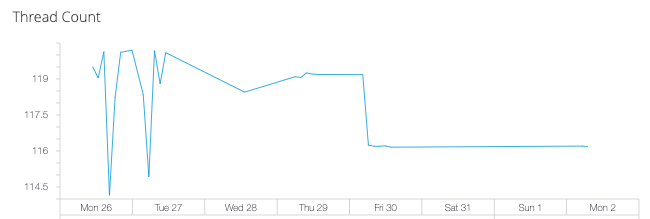
Monitor thread count to:
-
Detect thread leaks and excessive thread creation
-
Optimize application concurrency settings
-
Identify potential deadlock conditions
-
- Garbage Collection
-
Monitor garbage collection efficiency across different heap generations:
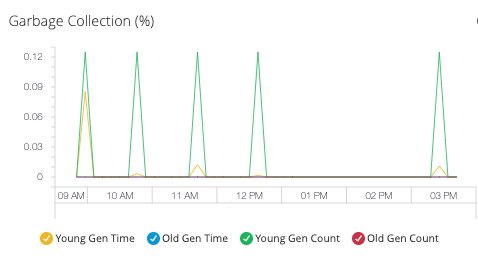
Garbage Collection Areas:
-
Young Generation: Collection frequency for short-lived objects in Eden and Survivor spaces
-
Old Generation: Collection patterns for long-lived objects requiring more intensive cleanup
Use GC metrics to:
-
Optimize heap size allocation between generations
-
Identify memory allocation patterns causing excessive GC pressure
-
Tune garbage collection algorithms for application performance
-
- Class Loading
-
Track dynamic class loading across all applications in the JVM:
Monitor class loading to:
-
Identify classloader memory leaks
-
Optimize application startup performance
-
Analyze dynamic code loading patterns
-
Server Group and Cluster Monitoring Dashboard
Monitor distributed infrastructure performance through aggregated dashboards that provide unified visibility across multiple servers organized in groups or clusters.
Overview
Server group and cluster monitoring enables centralized performance analysis across your distributed hybrid standalone infrastructure, providing:
-
Combined view of CPU, memory, and heap utilization across all servers
-
Side-by-side performance comparison between individual servers
-
Load distribution patterns across server infrastructure
-
Collective resource utilization for infrastructure planning
The group and cluster dashboard displays essential aggregated infrastructure metrics:
-
CPU Usage: Aggregate processing capacity utilization across all servers (percentage)
-
Memory Usage: Combined memory consumption across the infrastructure (MB)
-
Heap Total: Aggregate JVM heap allocation for all servers (MB)
-
Individual Server Breakdown: Per-server performance within the group context
Aggregated metrics appear as unified plot lines representing the collective performance of selected servers.
Access Group and Cluster Dashboards
To monitor aggregated performance metrics for your server infrastructure:
-
In Runtime Manager, click Servers.
-
Click the server group or cluster name to display the aggregated dashboard.
-
Select specific servers from the list to display comparative metrics in the details pane.
Dashboard Navigation
-
Time Range Selection
Monitor performance trends across different time periods:
Choose from available time ranges: * 3 Hours: Real-time infrastructure monitoring * 24 Hours: Recent performance analysis * 7 Days: Weekly infrastructure trends * 2 Weeks: Historical capacity analysis
-
Server-Focused View
Access server-specific performance data within the group context:
From the group dashboard, navigate to individual server dashboards by clicking server names to access detailed performance metrics and troubleshooting information.
Troubleshooting Server Group Monitoring
If monitoring metrics don’t appear immediately after configuring Anypoint Monitoring for servers in a server group, follow this systematic installation process:
-
In Anypoint Platform go to Runtime Manager > Servers > Add Server to create an Anypoint Runtime Manager token.
-
Execute the command provided in the Add Server screen.
-
In Anypoint Platform go to Runtime Manager > Servers > Create Group to create the server group.
-
Start Mule for all the servers to be added to the server group by using the command
./mule startfrom the$MULE_HOME/bindirectory. -
In Anypoint Platform go to Runtime Manager > Servers, click the server group name, and Add Server to add all the servers to the group.
-
Deploy an API to the server group.
-
Stop any running filebeat process in all the servers of the server group and run the
./installcommand from the$MULE_HOME/am/bindirectory in all the servers of the server group. -
In Anypoint Platform go to Runtime Manager > Servers, click the server group name, and restart all the servers in the server group via Actions > Restart.
-
Run
./setupfrom the$MULE_HOME/am/binfor all the servers in the server group.If after this step the metrics don’t show up, repeat the last two steps.