Creating Alerts for Mule Apps Deployed to Hybrid Standalone
Configure proactive monitoring alerts for your Mule applications deployed to hybrid standalone instances to ensure optimal performance, detect issues early, and maintain application reliability across your distributed integration environment.
Overview
Runtime Manager alerts for applications deployed to hybrid standalone are event alerts, such as deployment success, deployment failure, and application undeployed.
Application performance monitoring based on metrics, such as response time, throughput, and resource usage, isn’t available as Runtime Manager alerts. Use Anypoint Monitoring for those alerts. See Getting Alerts.
On US Cloud and EU Cloud, Runtime Manager also provides threshold conditions for number of errors, number of Mule messages, and response time.
|
On Canada Cloud, Japan Cloud, India Cloud, and Australia Cloud, Runtime Manager monitoring for hybrid standalone deployments isn’t available. Runtime Manager alerts on those control planes are limited to event alerts. For metric-based alerts, use Anypoint Monitoring. Basic and advanced Anypoint Monitoring alerts vary by control plane. See Features Supported on Hyperforce. Runtime Manager retains 30 days of alert history for audit and analysis. Alerts retrigger when conditions continuously exceed specified thresholds, ensuring persistent notification of ongoing issues. |
You can also create custom alerts for applications deployed to CloudHub and CloudHub 2.0.
CloudHub triggers custom alerts when your application sends notifications to the Runtime Manager console using Anypoint Connector for CloudHub (CloudHub Connector). See Custom Application Alerts and Notifications for information.
For applications deployed to CloudHub 2.0, custom alerts indicate whether an app deploys successfully and whether it’s behaving as expected. See Configuring Application Alerts for more information.
| For CloudHub 2.0, Alerts apply to applications only, not servers. |
Rate Limits on Alerts
Anypoint Platform enforces rate limits to control alert frequency and prevent excessive email notifications. There’s no defined limit to the number of Runtime Manager alerts.
Create an Alert
Configure alerts to monitor your Mule applications with customizable thresholds and notification settings.
-
In Runtime Manager, click Alerts.
-
If no alerts exist, you see the initial setup page:
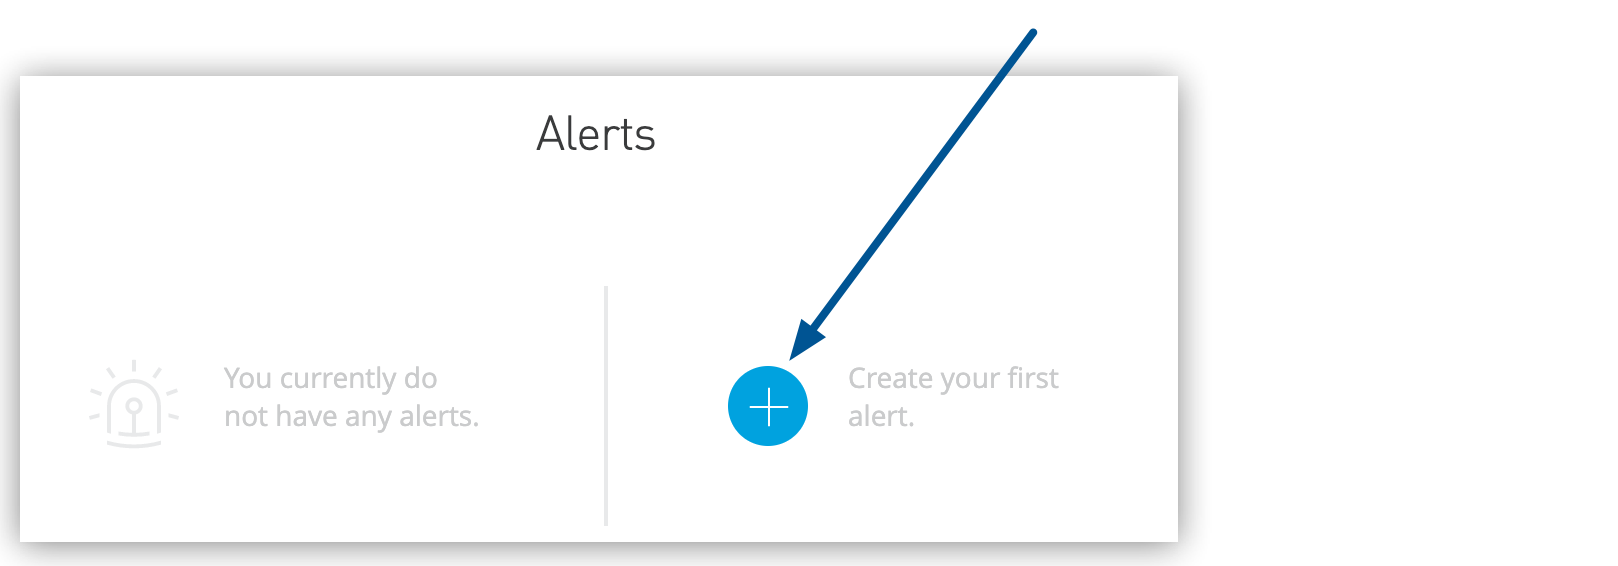 Figure 1. The arrow shows the Create your first alert option.
 -
For existing alert configurations, use the add button:
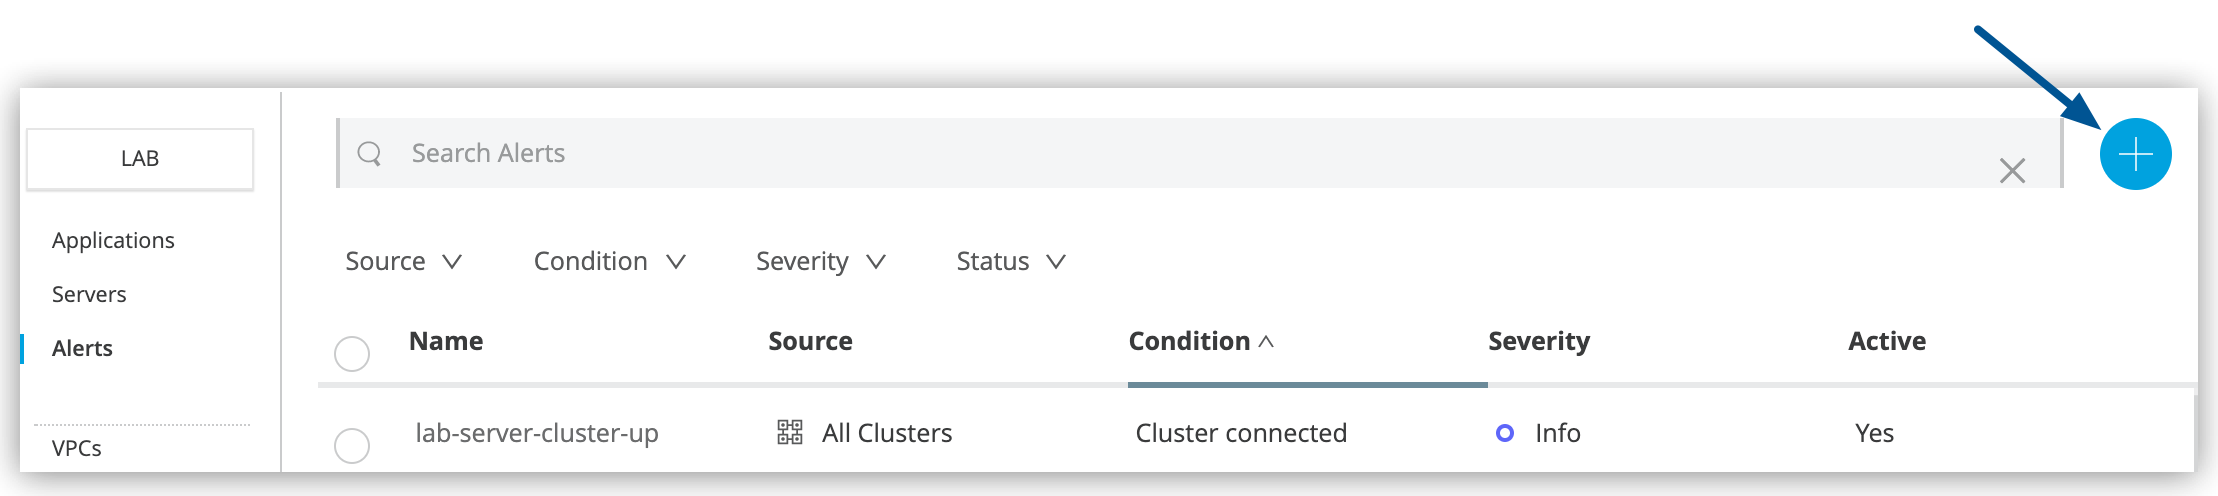 Figure 2. The arrow shows the blue plus (+) icon on the Alerts page.
-
-
Click the blue plus (+) icon to create a new alert.
-
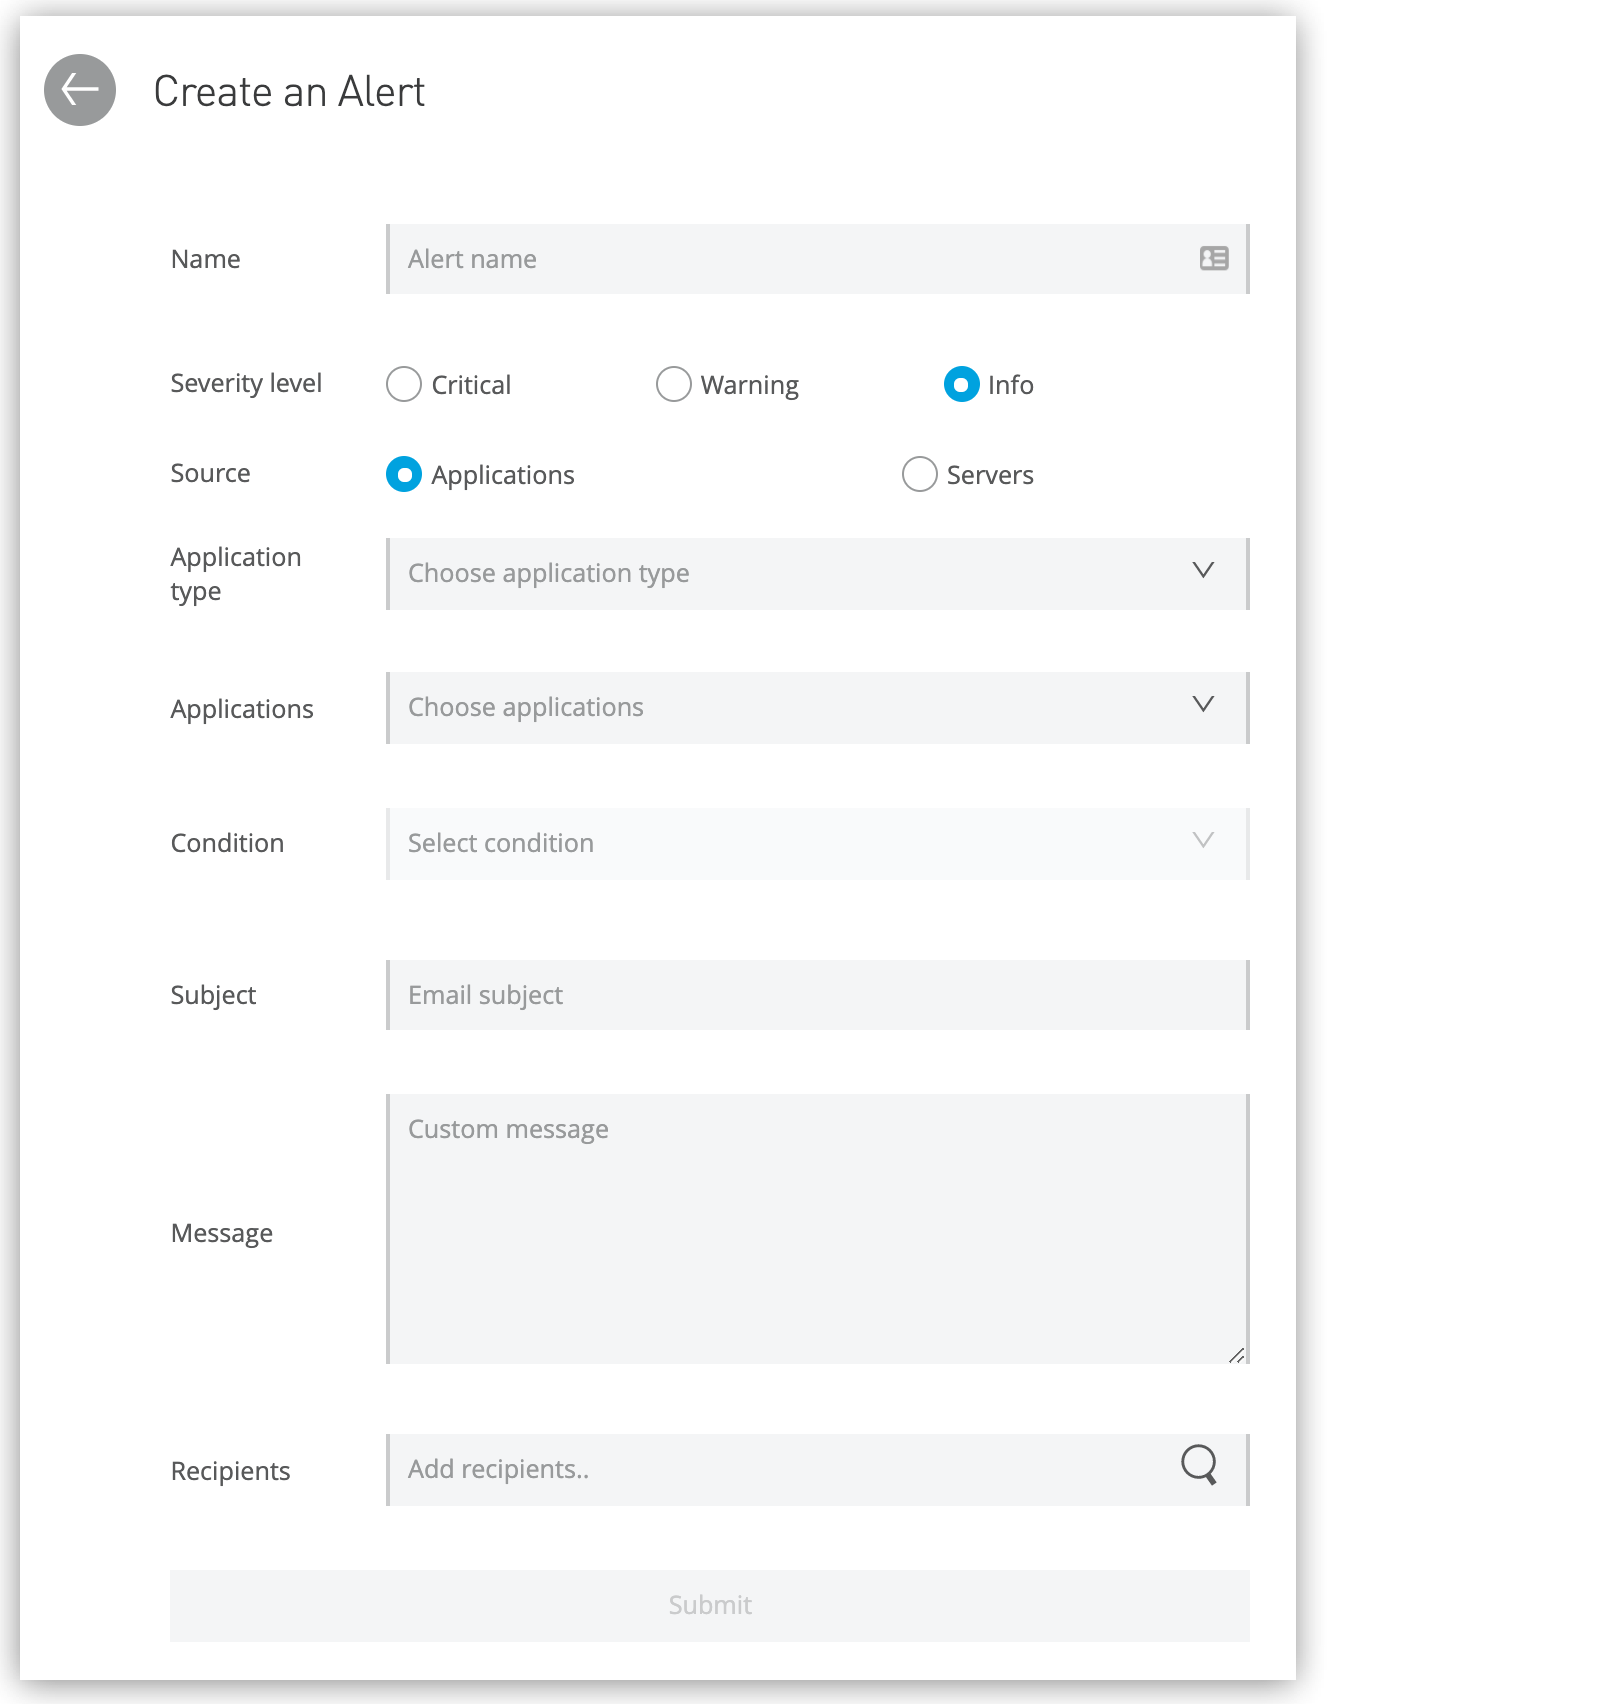
Complete the required fields:
-
Name
Unique and meaningful name for the alert
The Name is limited to 256 characters.
-
Severity level
Severity of the alert: Critical, Warning, or Info
-
Source
The source of the alert: applications
-
Application type
When the source is Applications, applications deploy to either CloudHub or local servers. Runtime Fabric application alerts are supported only using Anypoint Monitoring.
You can’t create an alert that applies to both applications deployed to CloudHub and local servers. You must create separate alerts for each deployment type.
-
Applications
The application to apply the alert to
-
Condition
The condition that triggers the alert
The available options depend on whether your alert is linked to an application running on CloudHub, or an application running locally. Some conditions require additional data. See Alert Conditions.
-
Subject
The subject of the alert email to send when the alert is triggered
The subject can include variables. See Alert Variables.
-
Message
The body text for the email to send when the alert is triggered. The message body can include variables. See Alert Variables.
-
Recipients
The recipients of the alert email
You can select up to 20 platform user IDs and enter up to 20 email addresses.
-
-
Click Create Alert.
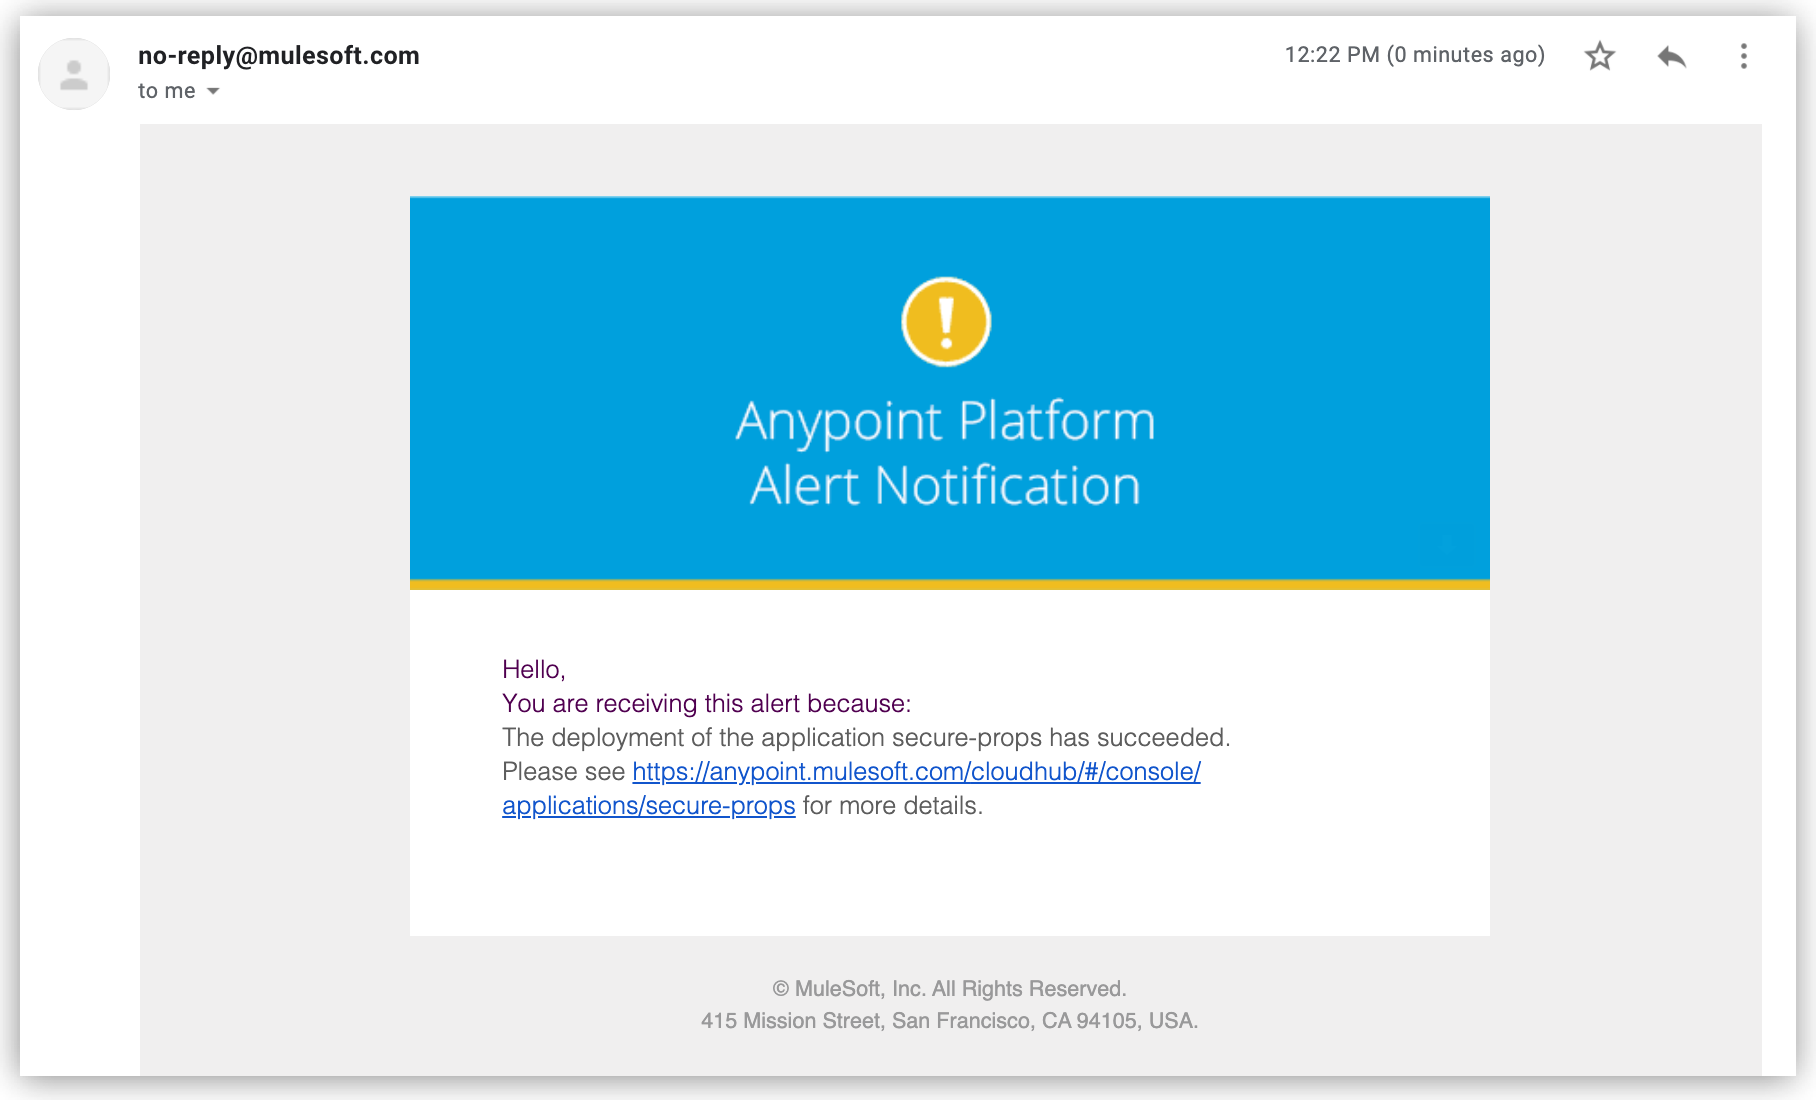
When an alert condition is triggered, Runtime Manager sends email notifications similar to this:
Alert Conditions
Configure specific conditions that trigger notifications based on your application monitoring requirements. Alert conditions range from simple status notifications to complex performance threshold monitoring.
Conditions for Applications Deployed to CloudHub
For applications deployed to CloudHub, these alert conditions apply:
- CPU usage - CloudHub
-
The CPU usage of the CloudHub workers that run the application is above or below the percentage for the specified period of time.
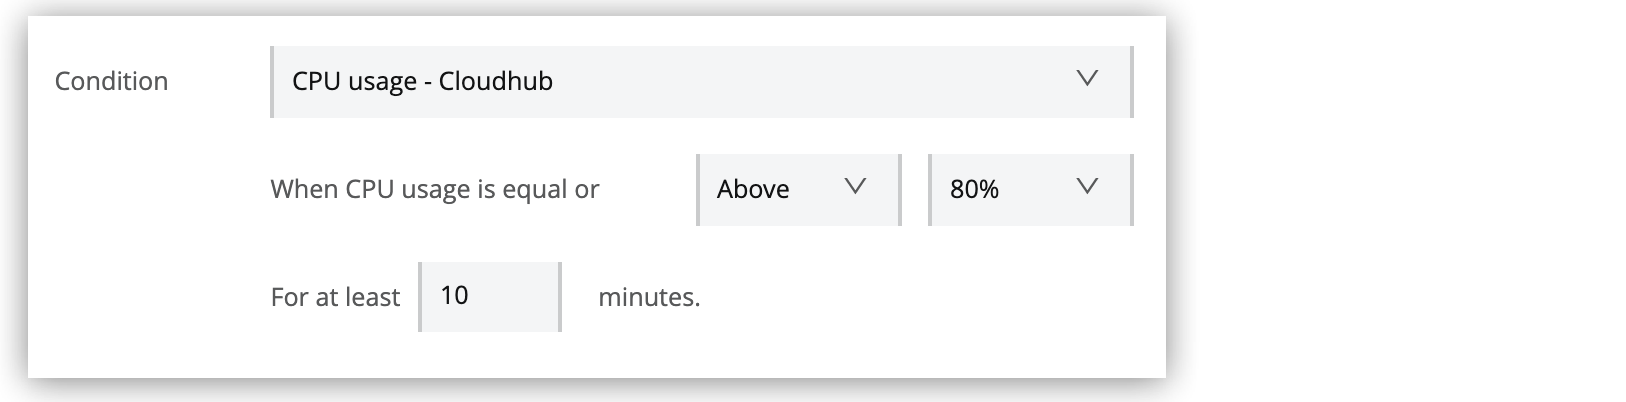
To enable this condition, specify the percentage and duration that triggers the alert.
- Custom application alert
-
The custom notification contains the specified text.

To enable this condition, specify the notification text from the CloudHub Connector in your Mule application. When the text in one of the notifications matches the specified string, an alert is sent.
- Exceeds event traffic threshold
-
The number of events of any type exceeds the threshold for the specified period of time.
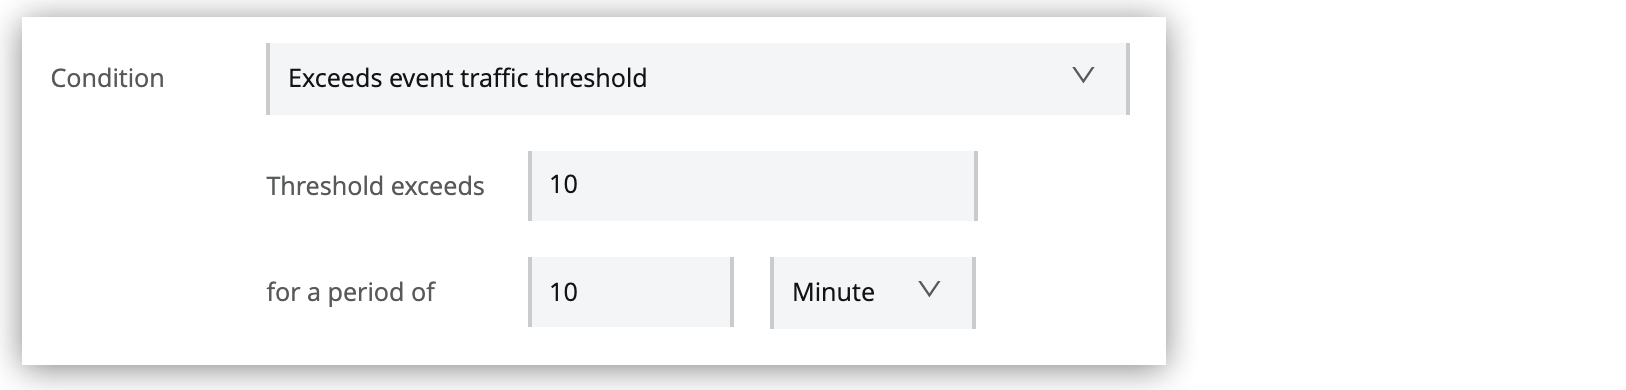
To enable this condition, specify the capacity threshold and duration that triggers the alert. This alert condition depends on the events you are tracking in your application. For information, see Business Events.
- Memory usage - CloudHub
-
Memory usage is a percentage that represents the JVM heap-used/JVM total memory. The alert triggers if the memory usage is above or below the limit for the specified period of time.
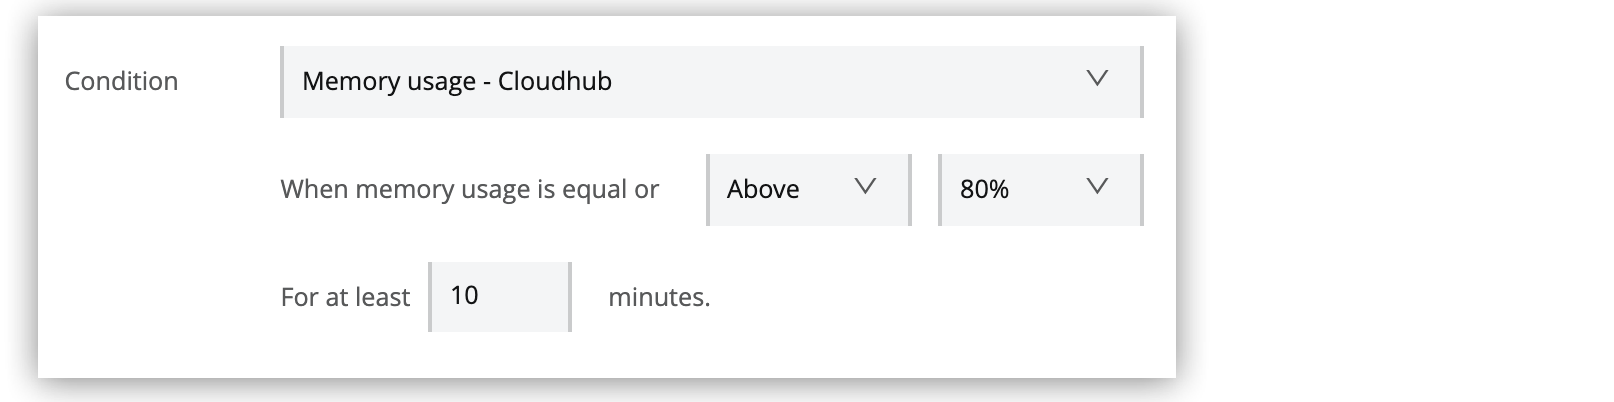
To enable this condition, specify the percentage and duration that triggers the alert.
These alerts for applications deployed to CloudHub require no additional parameters:
-
Deployment failed
-
Deployment success
-
Secure data gateway connected
-
Secure data gateway disconnected
-
Worker not responding
Conditions for Applications Deployed to Local Servers
These threshold conditions apply on US Cloud and EU Cloud. They aren’t available as Runtime Manager alerts on Canada Cloud, Japan Cloud, India Cloud, and Australia Cloud. Use Anypoint Monitoring alerts for metric-based monitoring on those control planes.
For applications deployed to local servers, these alert conditions apply:
- Number of errors
-
The number of messaging errors reported by Mule runtime server in one minute reaches the specified limit. The number of errors reported depends on error handling configuration in the app. For information about Mule errors, see Mule Errors.
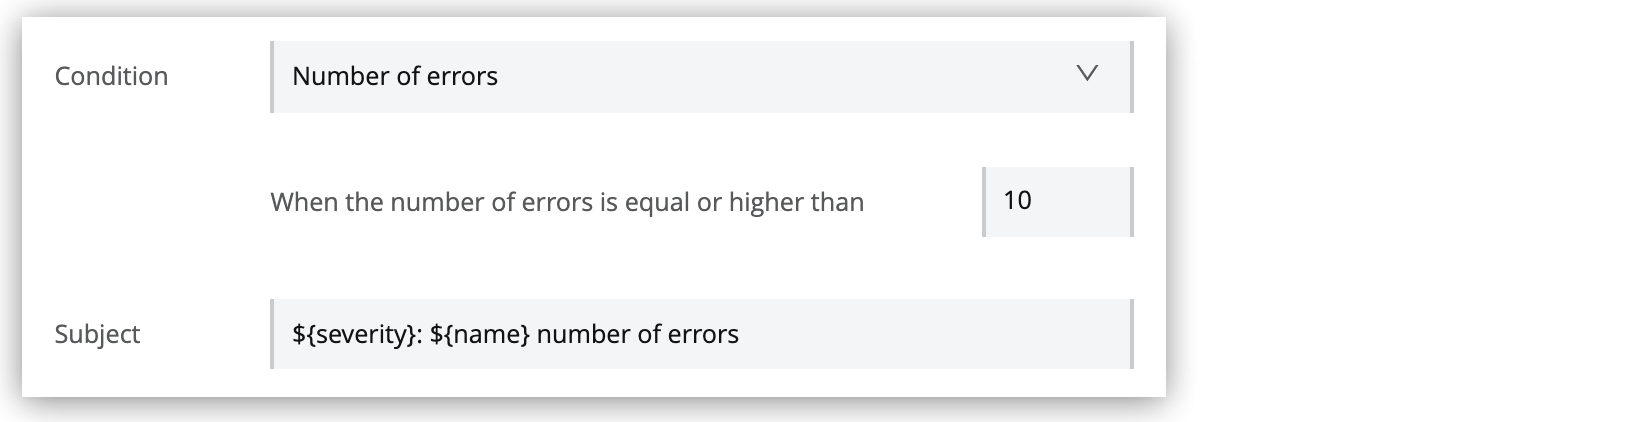
To enable this condition, specify the number of errors per minute that triggers the alert.
- Number of Mule messages
-
The number of Mule messages since the application started reaches the specified limit.

To enable this condition, specify the number of Mule messages that triggers the alert.
- Response time
-
The response time reaches the specified limit.

To enable this condition, specify the maximum response time that triggers the alert.
These event alerts for applications deployed to local servers require no additional parameters. They are available on all control planes that support hybrid standalone:
-
Application undeployed
-
Deployment failure
-
Deployment success
Alert Variables
Customize alert email subjects and messages using dynamic variables that provide contextual information about triggered events.
You can’t use the character combination $& in variable expressions.
|
| Alert Category | Alert Type | Available Variables |
|---|---|---|
All Alerts |
|
|
CloudHub App Alerts |
CPU usage - CloudHub |
|
Memory usage - CloudHub |
||
Custom application notification |
|
|
Deployment failed |
|
|
Deployment success |
|
|
Worker not responding |
||
Exceeds event traffic threshold |
|
|
Hybrid App Alerts |
All Hybrid App Alerts |
|
Number of Mule messages |
|
|
Number of errors |
||
Response time |
||
| Variable | Definition |
|---|---|
|
Current value of metric that triggers the alert |
|
Where to find more information about the alert |
|
Message from the notification that trigger the alert |
|
Name of the app that triggers the alert |
|
An operator, such as |
|
Period of time over which to measure |
|
Period of time unit |
|
Priority of the notification that triggers the alert |
|
Name of the app that triggers the alert |
|
Severity of the alert |
|
State of the resource that triggers the alert, such as Running or Disconnected |
|
Count over the period of time that triggers the alert |
|
Transaction ID defined in the app or assigned by Mule |
|
Anypoint Platform organization name |
|
A value associated with an element |
Access and View Alerts
Runtime Manager provides multiple ways to access and monitor your application alert configurations and history.
Global Alert Management
Access all application alerts from the main alerts dashboard:
-
In Runtime Manager, click Alerts:
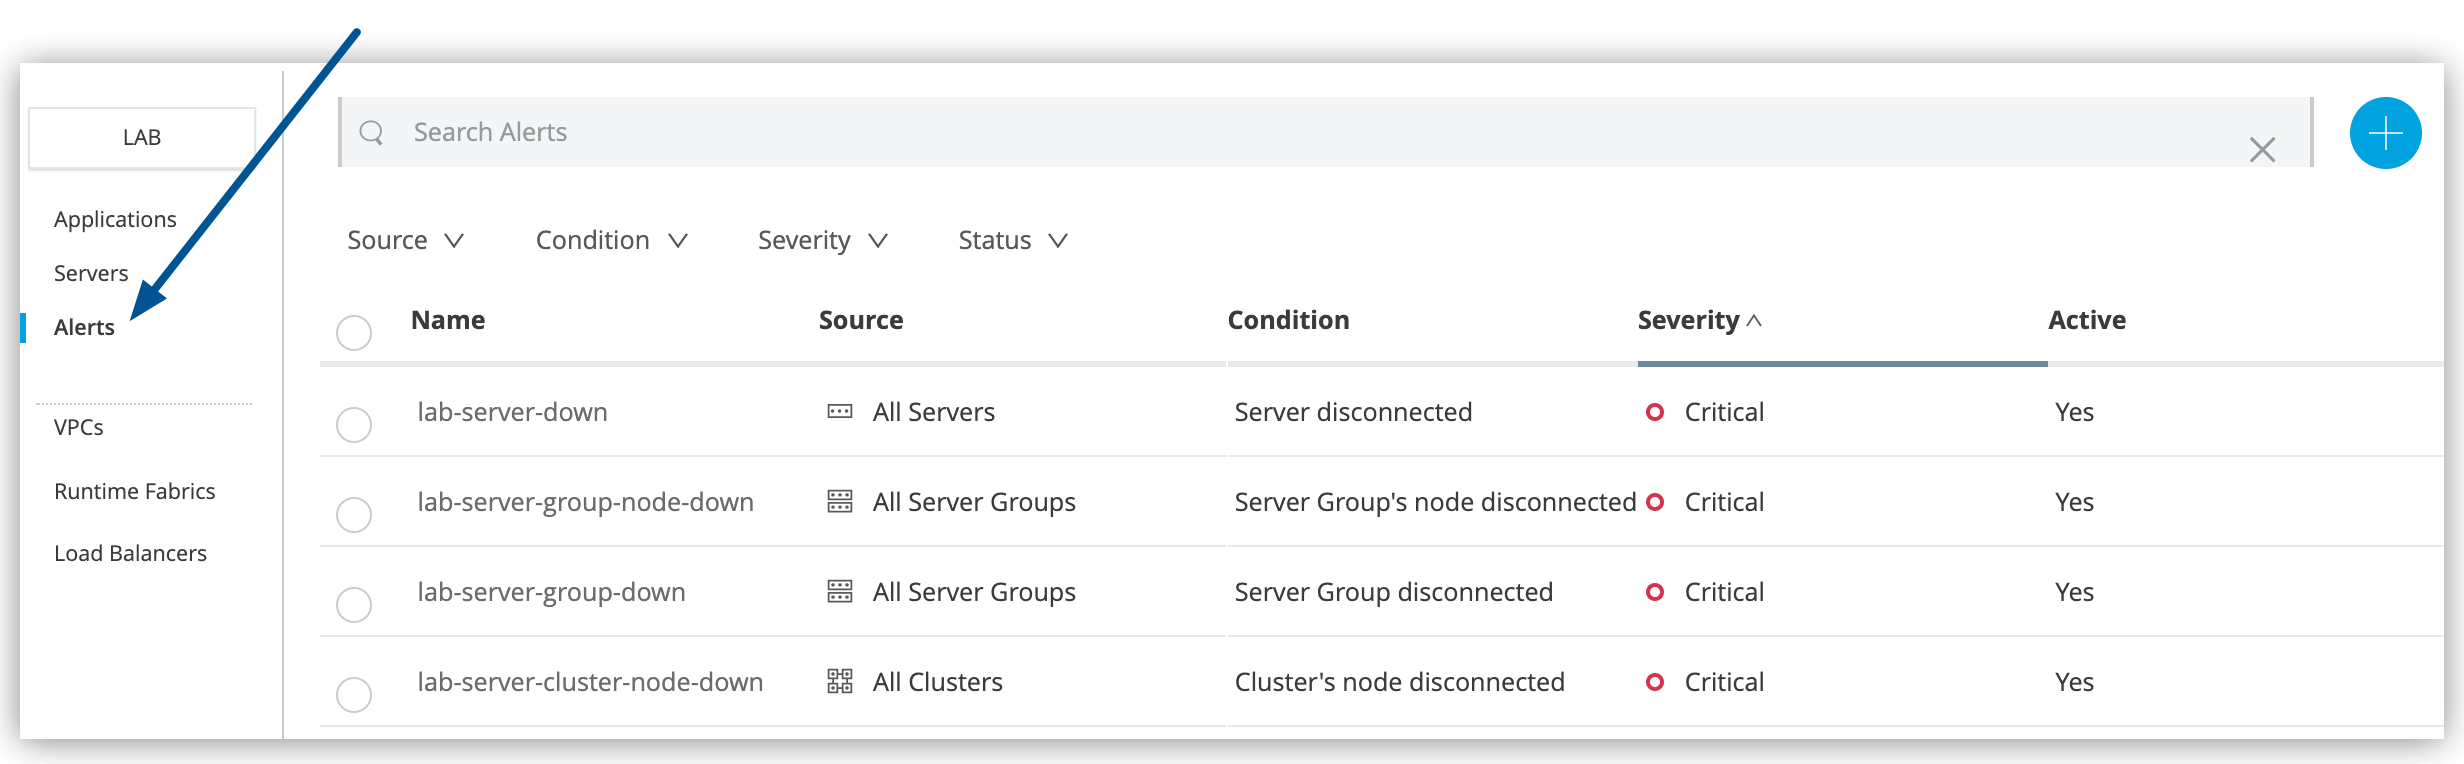 Figure 3. The arrow shows the Alerts menu.
From the alerts dashboard, you can:
-
Create new application alerts
-
Search alerts by name or configuration
-
Filter alerts by source, condition, severity, or status
-
Modify alert configurations by clicking alert names
-
View alert status, settings, and trigger history in the details pane:
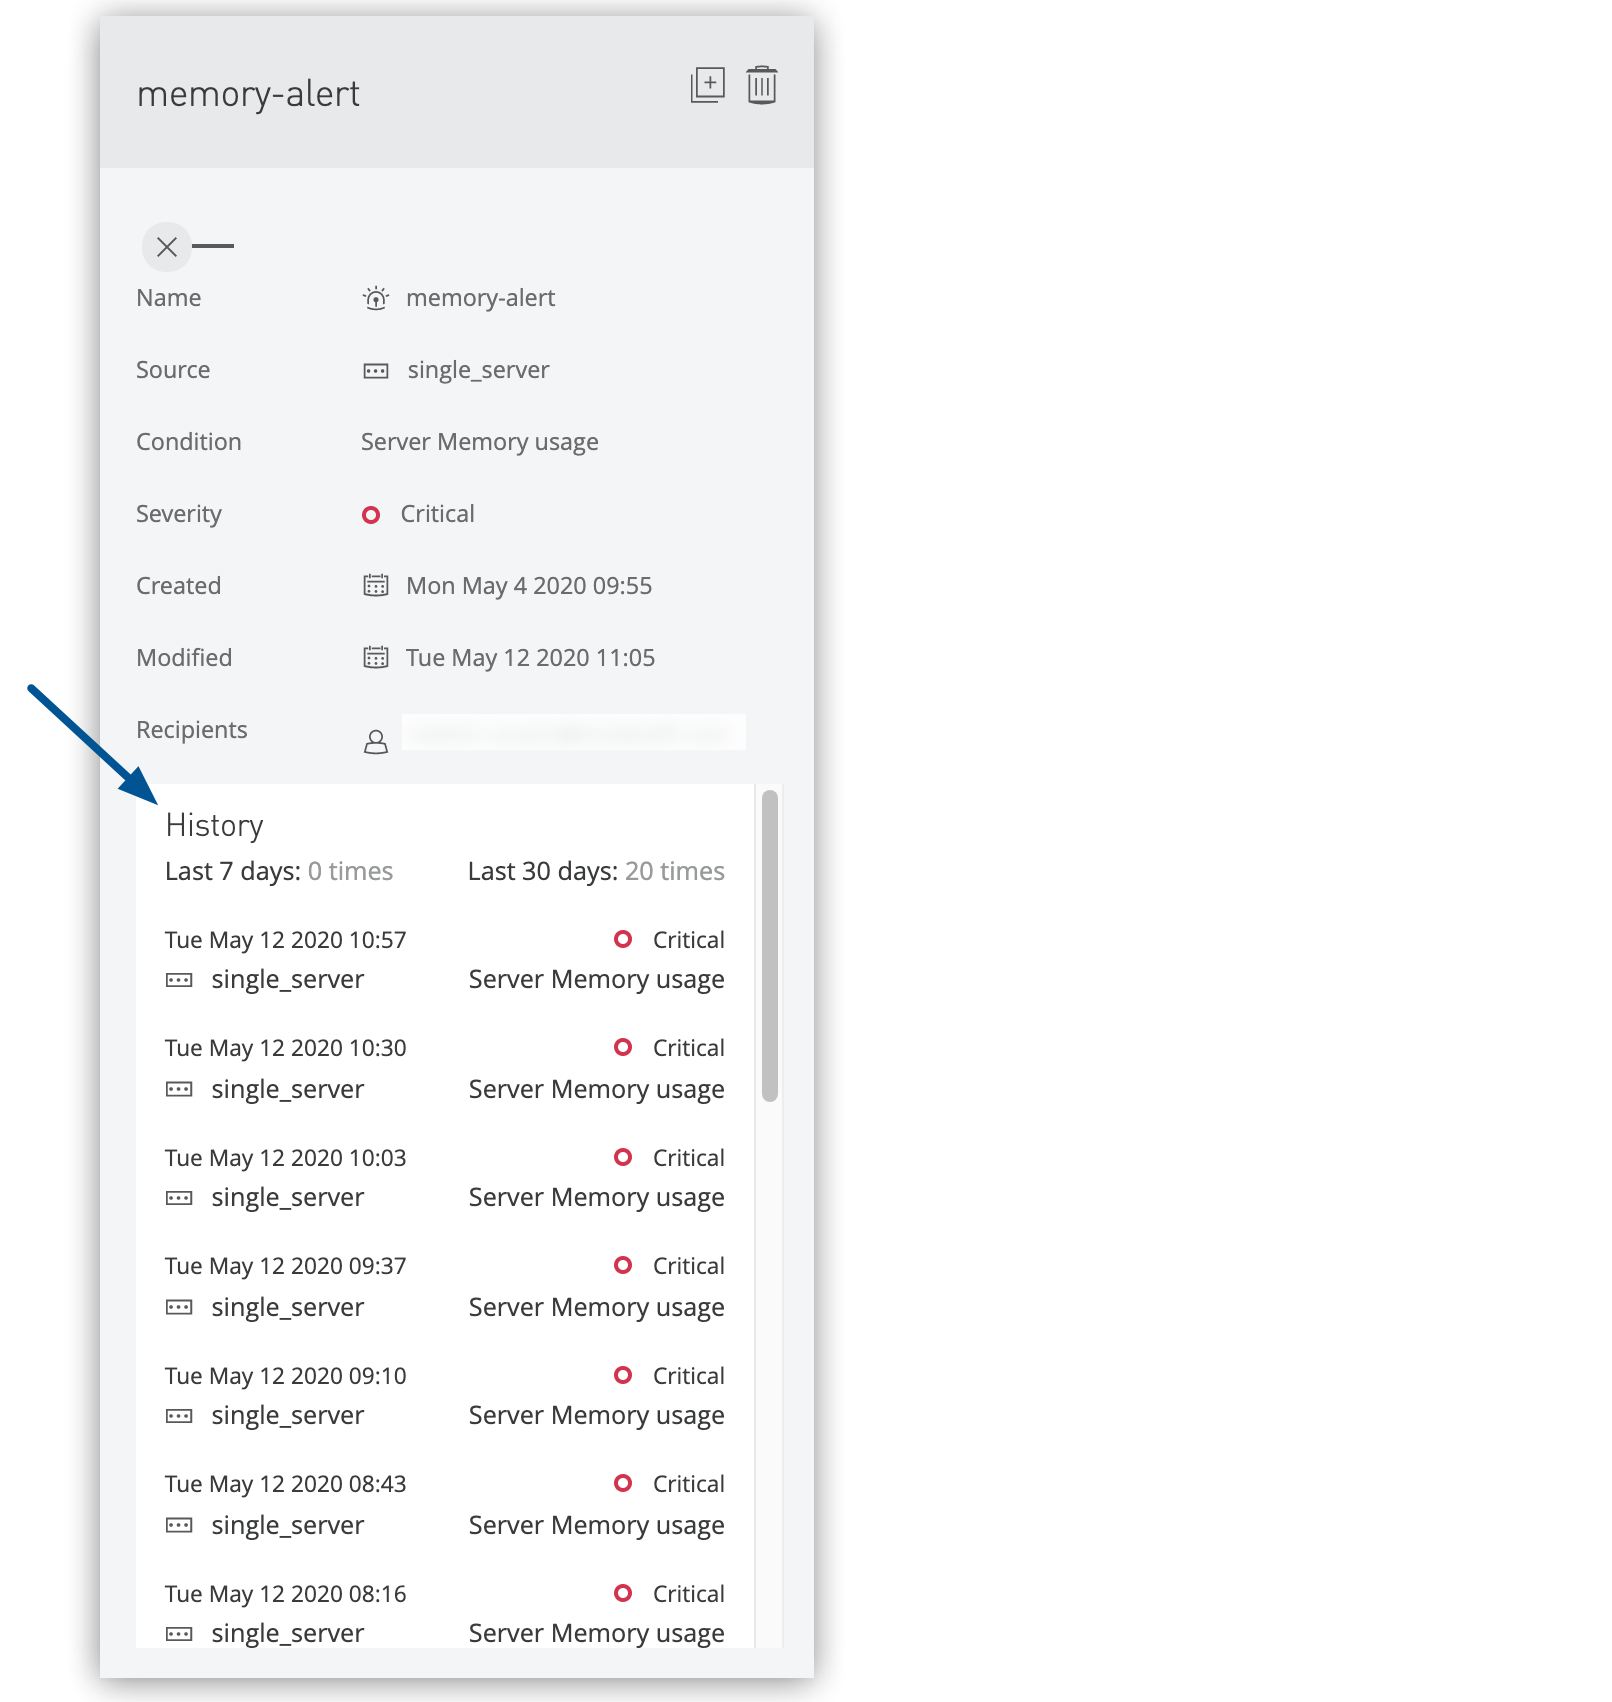 Figure 4. The arrow shows the alert history in the details pane.
Application-Specific Alert Views
View alerts associated with specific applications:
-
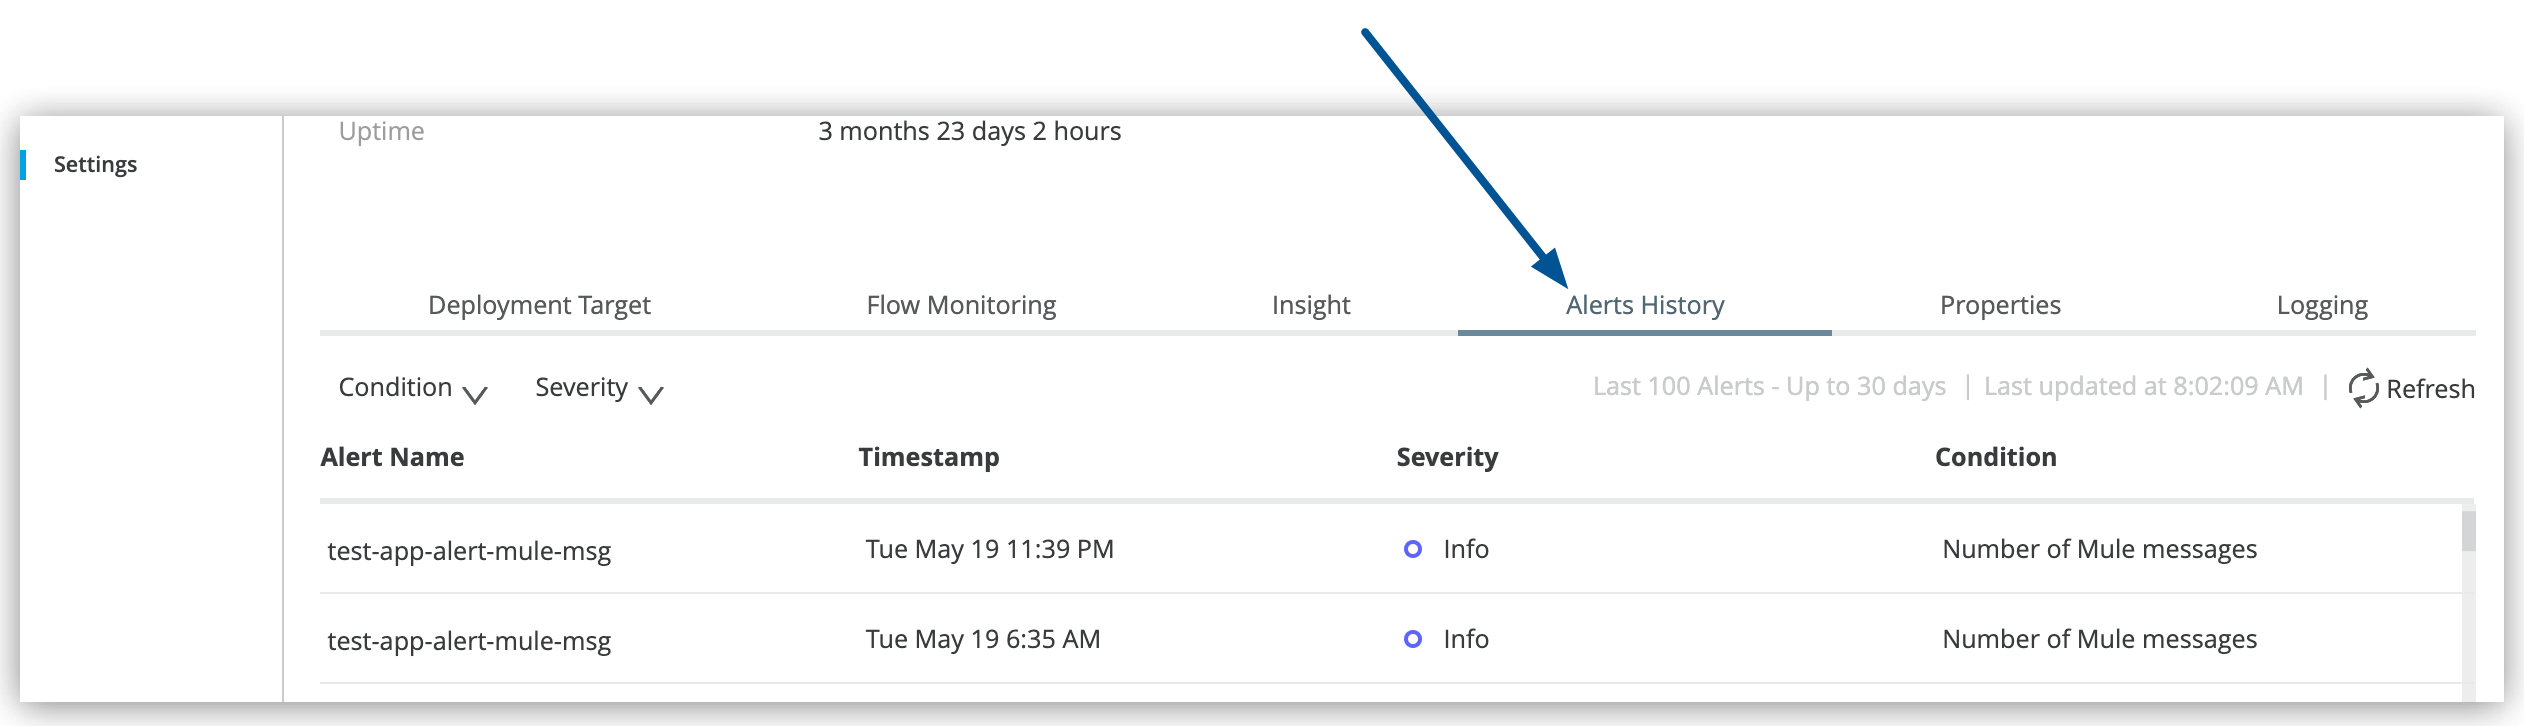
In the Applications list, click the Status column for your target application.
-
Click the View Associated Alerts link in the details pane:
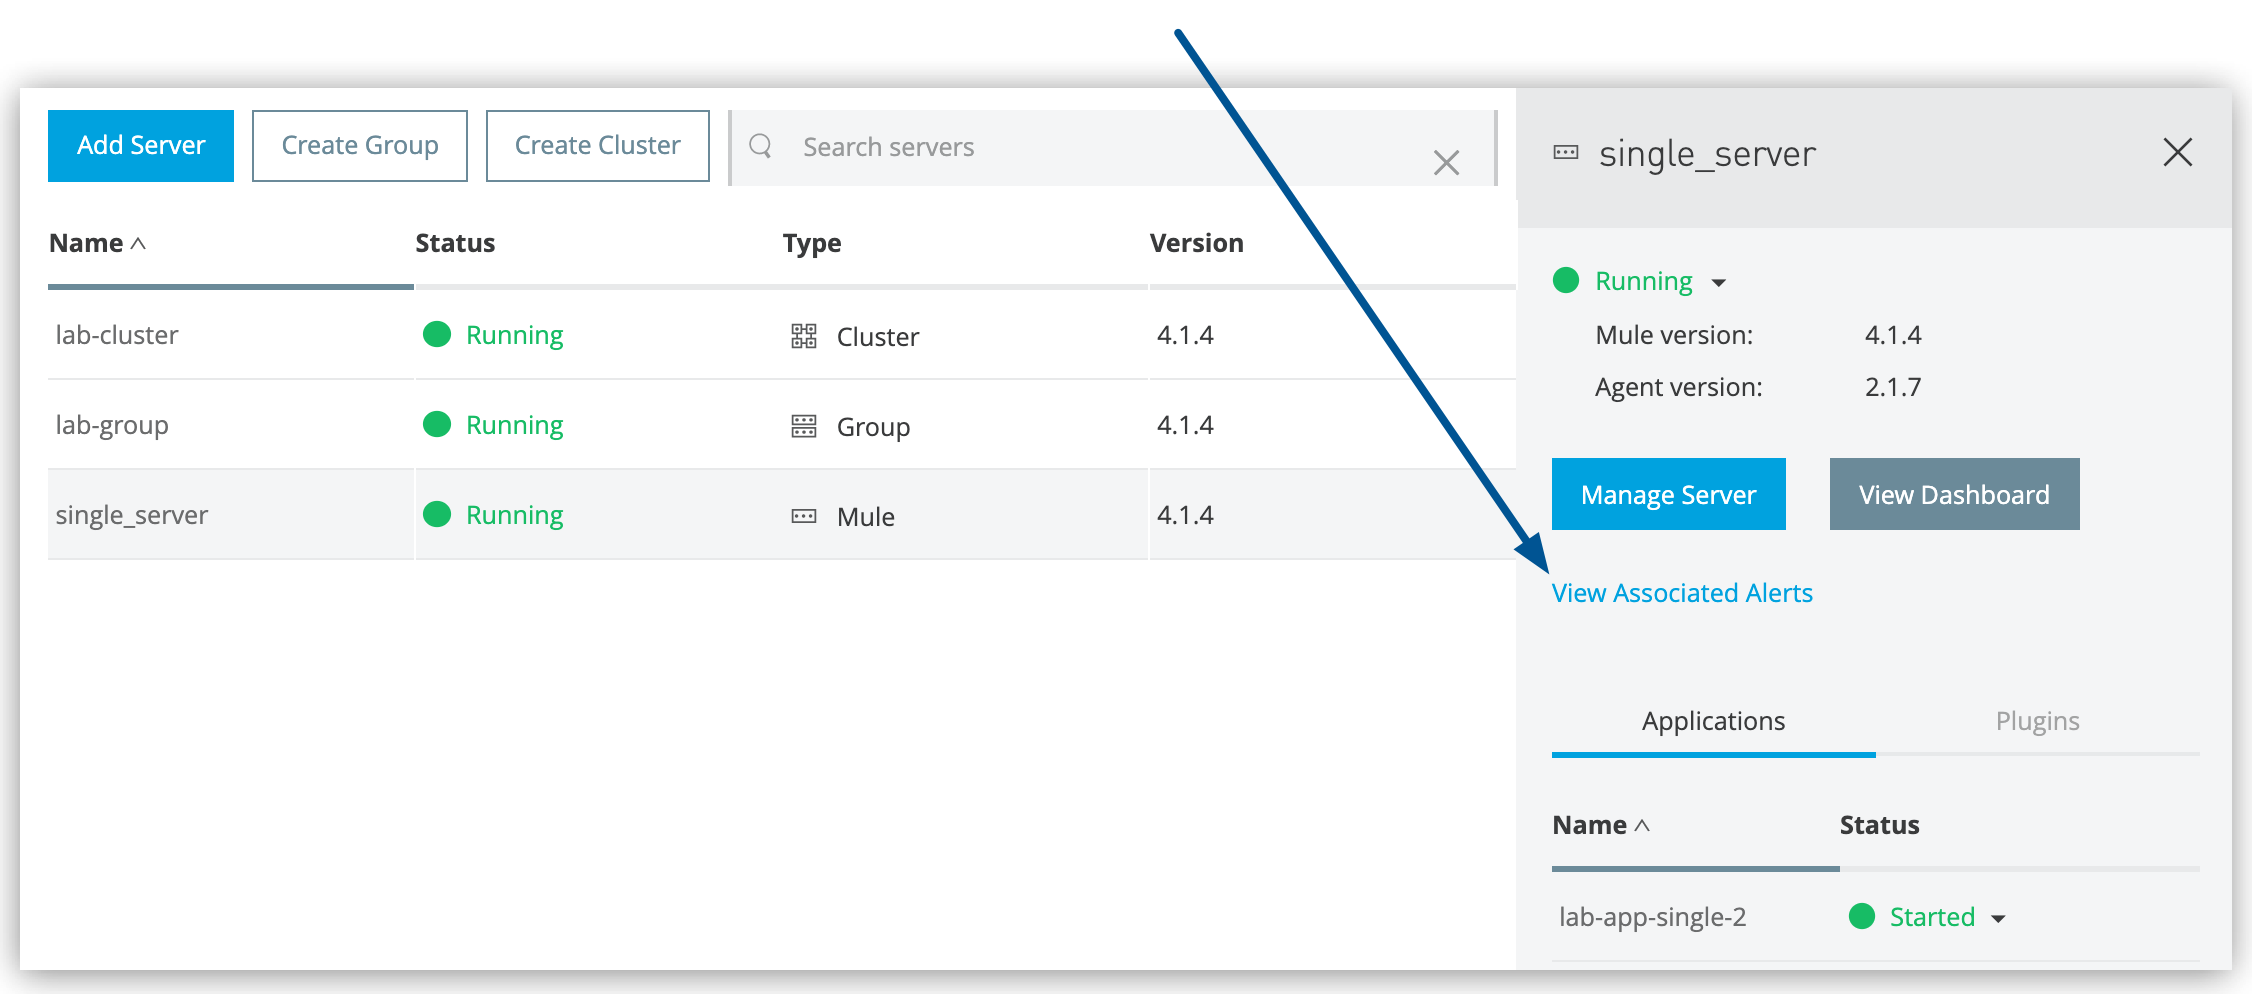 Figure 5. The arrow shows the View Associated Alerts link in the details pane.
Manage Alerts
Efficiently manage your application alert configurations through Runtime Manager’s alert management interface.
Alert Management Operations
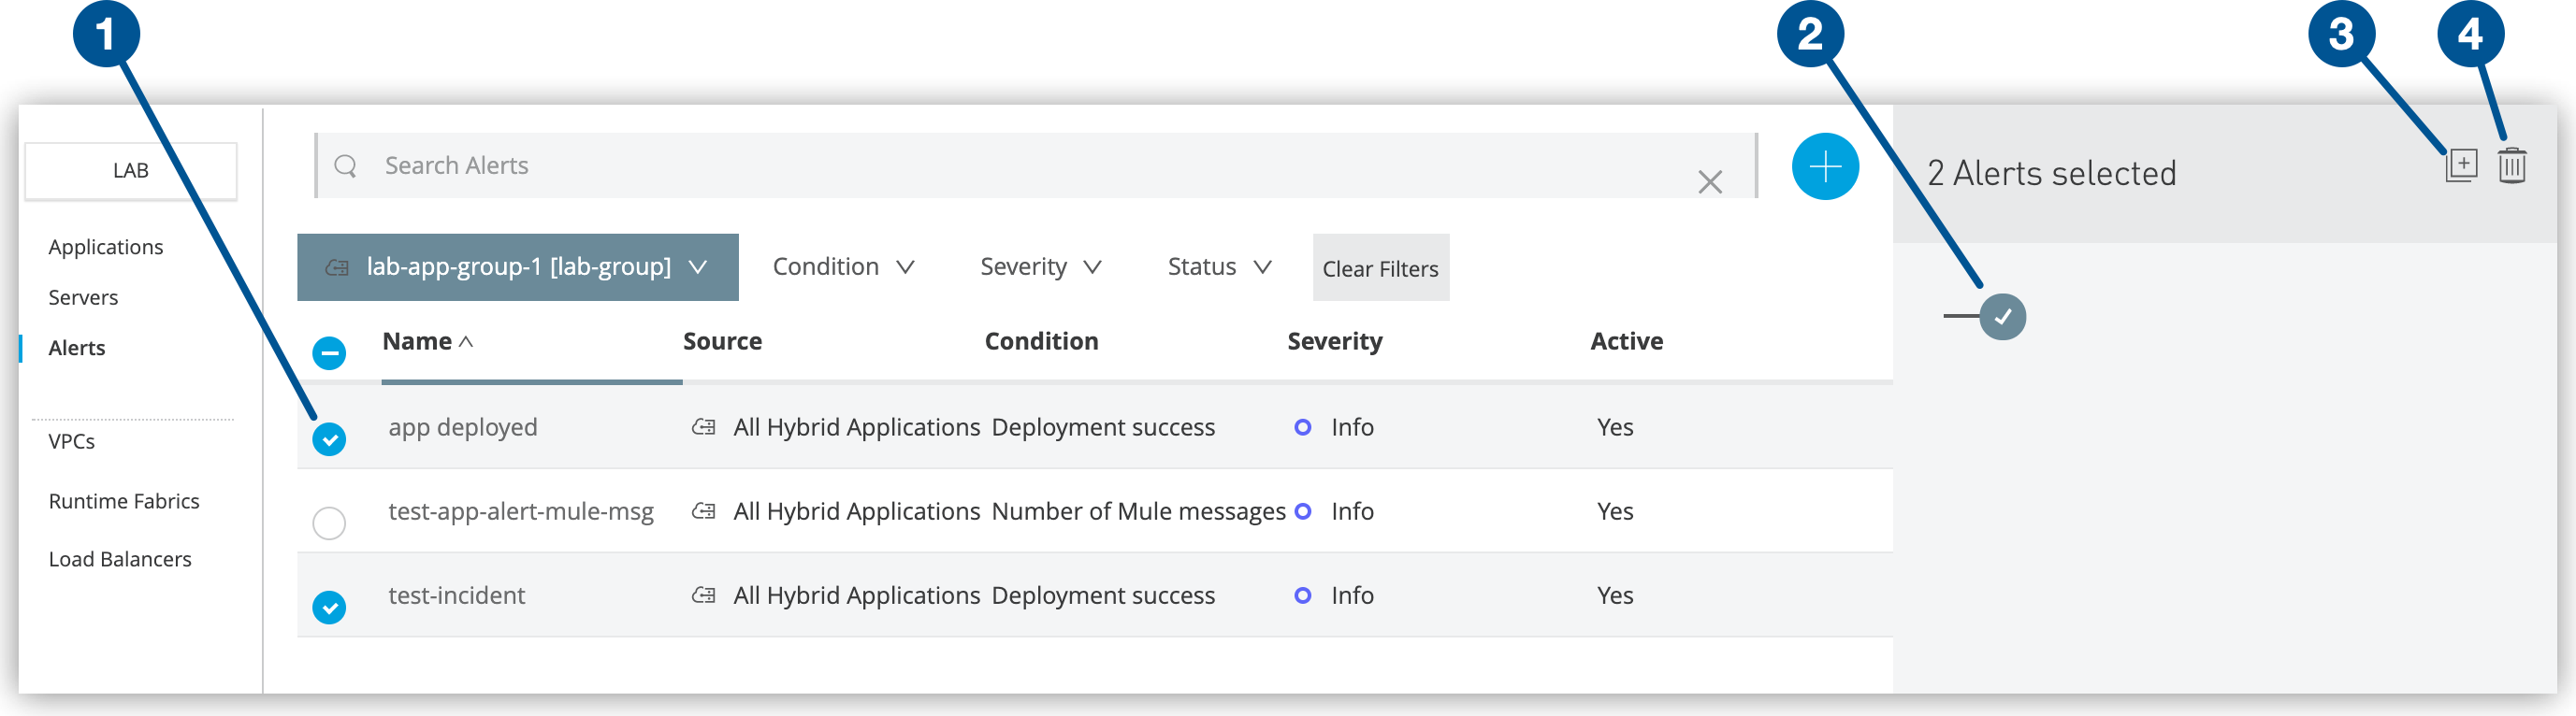
From the Alerts page, select one or more alerts and use the management controls:
Enable and Disable Alerts
Control alert notification delivery for application monitoring:
-
Disable alerts: Click the toggle switch to turn off notifications:
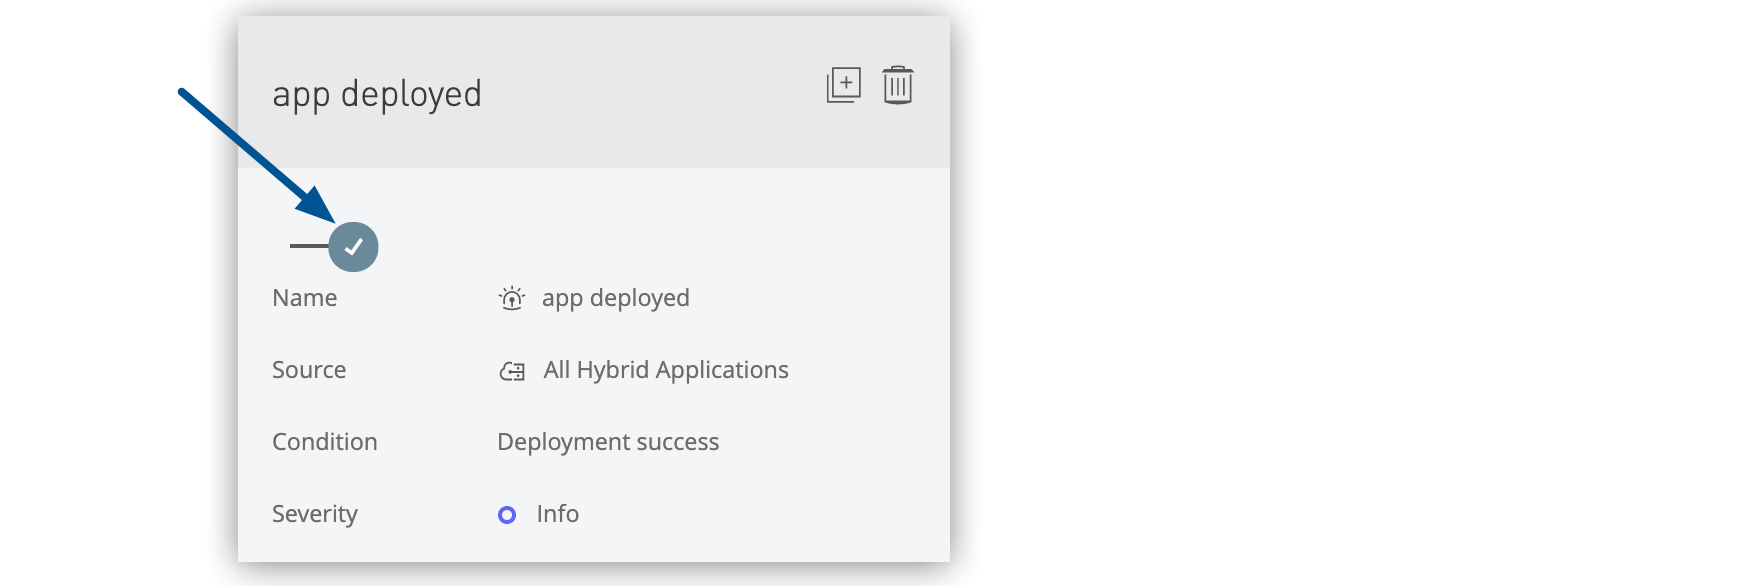 Figure 8. The arrow shows the alert switch on.
The Active column changes from Yes to No.
-
Enable alerts: Click the toggle switch to turn on notifications:
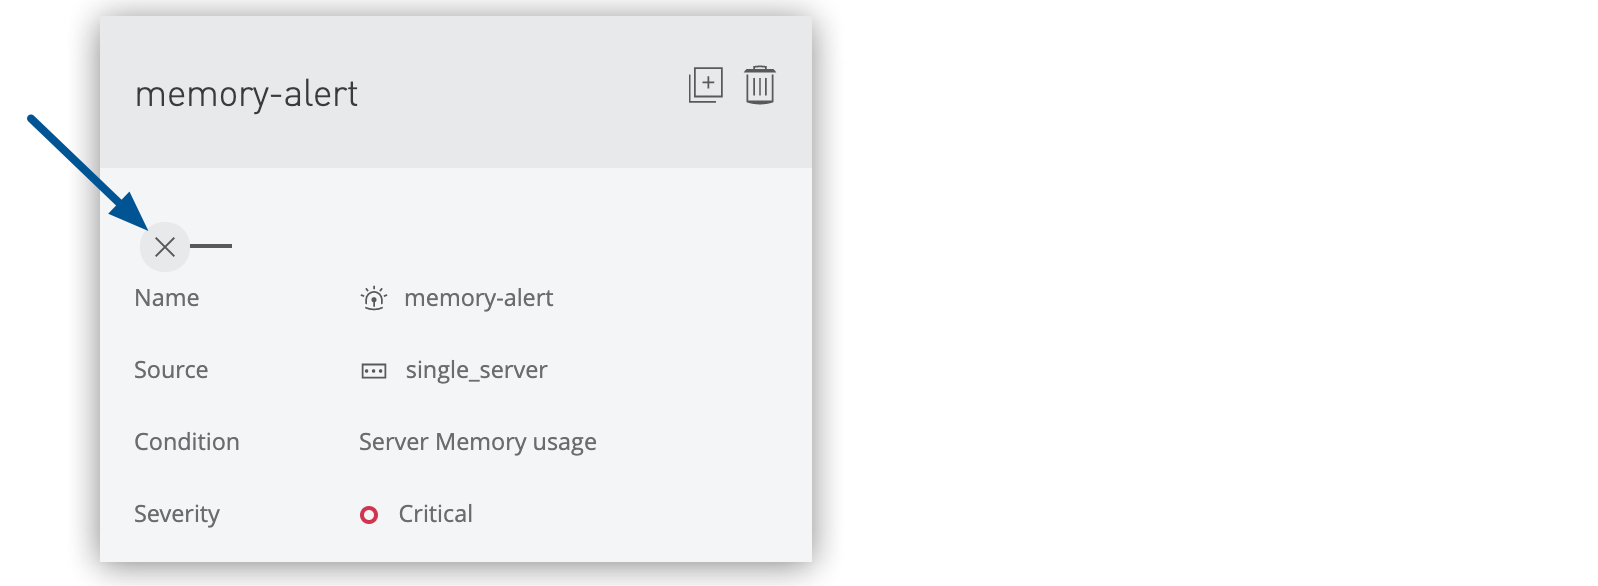 Figure 9. The arrow shows the alert switch off.
The Active column changes from No to Yes.
| Alert state changes affect all recipients of the alert notifications. |
Duplicate Alerts
Create copies of existing alert configurations for similar applications:
-
Select one or more alerts from the list.
-
Click the Duplicate icon in the details pane:
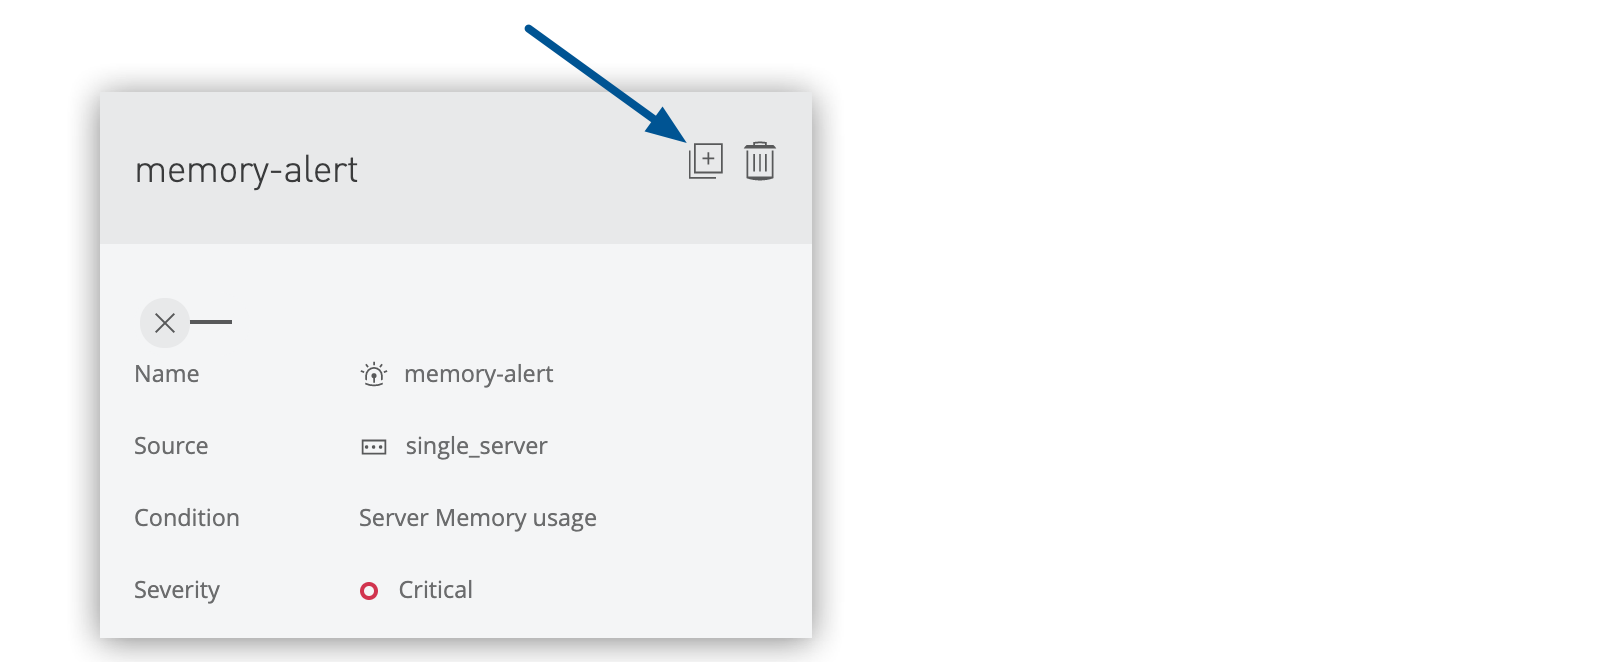 Figure 10. The arrow shows the Duplicate alert icon.
Runtime Manager creates alert copies with -copy appended to the original alert names.